


2024 Technical Paper #4
Energy Baselining Essentials
Author: Charles Tuck, Co-Founder and VP of Energy & IoT Solutions Ndustrial.io
Abstract
Before companies can report on progress toward sustainability goals, they need to establish a baseline. This paper outlines fundamental best practices for creating a useful energy baseline: defining the metrics upfront, normalizing the data, setting up real-time monitoring, and submetering specific processes. These are not definitive requirements but serve as a useful guide for companies aiming to establish an energy management program. A simple approach can be sufficient for creating a baseline, but the more robust the baseline and monitoring system, the more effectively companies can act on the information provided.
Introduction
For any company pursuing energy or sustainability goals, the first step is setting a baseline. Executing this correctly the first time is crucial because it can save time and money in the future, rather than scrapping the baseline and starting over with the addition of new sites or assets.
One approach to baselining involves benchmarking a company’s performance against others in the industry. However, industry benchmarking is very specific to each type of operation and is not widely available for the majority of industries.
For example, ENERGY STAR publishes a benchmark for frozen fried potato processing, but not for the processing of other frozen foods. Therefore, this paper focuses on establishing a baseline using a company’s internal data, which represents an approach that can be used by all.
A good baseline does not just help companies track savings but also identify areas for improvement, fend off claims of “greenwashing,” and secure lower-interest loans – but only if the data is trustworthy and accessible.
To establish a meaningful energy baseline, consider these four fundamentals:
- Defining the metrics
- Normalizing the data
- Real-time monitoring
- Submetering specific processes
Defining the Metrics: Begin with the End in Mind
The scope, costs, and benefits of energy monitoring projects can vary widely. There is no generally accepted standard cost of setting up this infrastructure nor widely generalizable data on the savings or return on investment that can be achieved. Therefore, companies must define their objectives up front and craft a scope of work according to their goals and budget.
For example, if the goal is simply to track monthly energy consumption to facilitate energy budgeting and reporting, a platform that aggregates utility bills is likely sufficient and requires little to no capital investment. The downside is that utility bill data can have significant lag times and gaps, and it can be difficult to measure the effects of energy conservation measures without further granularity.
If the goal is to provide actionable information to facility operators, a more robust metering infrastructure is required. Here too, an approach can be crafted that meets the capital constraints of the project. The common assets that should be metered include the main service, plant-generated utilities (e.g., compressed air and steam), and major processes.
ISO 50001 Energy Management is a helpful reference for determining the most significant energy users within a facility and those that have significant potential for improvement. These are the most important assets to submeter, and additional submetering can be added as the budget allows.
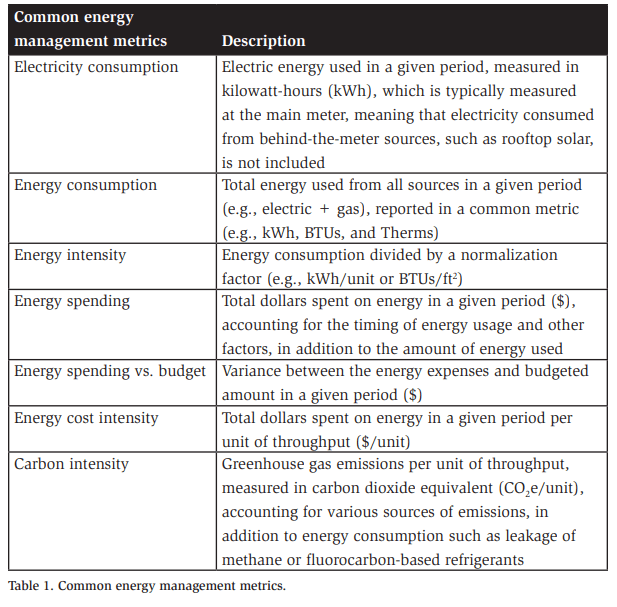
In short, energy metering and monitoring should be employed in service of a predetermined metric or set of metrics. Baseline data should be collected in a way that it is comparable to some desired future state, to properly measure progress (Table 1).
Normalizing the Data: Enabling Valid Comparisons
To make sense of energy data, companies need to put it in context. Normalization is the process of putting data into context, essentially dividing it by a common factor. This enables more valid comparisons among the measured data.
For example, what if the baseline period coincides with particularly extreme weather? Removing the effects of weather is a common way to normalize baseline data, creating a more trustworthy comparison between the baseline and future observations.
A simple approach is to average multiple years of baseline data, reducing the chances that a single year of extreme weather or other disruptions will significantly bias the baseline. Note that for businesses significantly affected by the pandemic, 2020 should not be used as a baseline year, regardless of normalization. A more robust approach involves linear regression analysis, to control for variables such as temperature and humidity.
For industrial operations, it is also critically important to understand energy consumption in relation to production. In other words, it is fine if energy usage increases, as long as throughput increases by a greater margin. Measuring productionnormalized energy intensity allows businesses to understand the true meaning of their energy consumption.
A proper project scoping exercise should attempt to determine the factors that influence energy consumption the most. In many industrial environments, production is the most important normalizing factor. However, in facilities with high HVACR loads, weather normalization may be more significant.
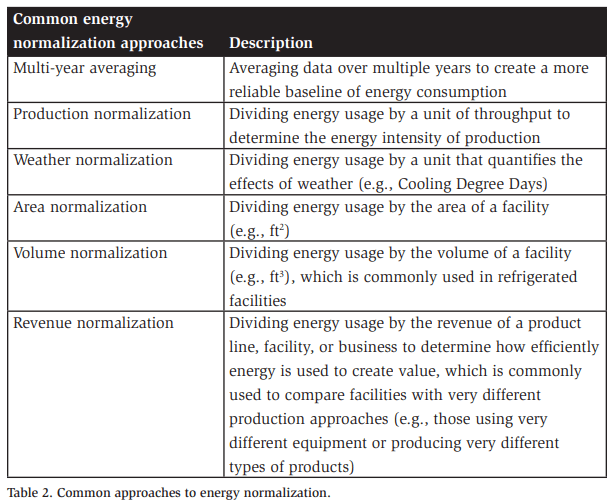
There are many other normalizing factors to consider, such as square footage, volume, and revenue. Some companies may also want to divide their data by customer or by product. All these comparisons provide a more meaningful or relatable understanding of energy usage (i.e., an understanding that can be used to drive results). It is often necessary to consider multiple metrics at once to obtain a more complete picture of energy performance (Table 2).
Real-time Monitoring: Creating an Actionable Baseline
Many companies simply tally up their utility bills to get a snapshot of their energy spend. This approach is simple and inexpensive.
The problem is that this type of data is not actionable. It does establish a baseline, but it does not set companies up for success. For example, it does not indicate:
- When energy usage is highest
- When rates and demand charges are highest
Instead of being charged a flat rate for electricity like residential consumers, most commercial and industrial electric customers are charged using some form of timeof-use rate, whereby rates vary by the time of day, week, and year. Depending on the contract, these rates may be known well in advance, or they may only be published a day or 15 minutes in advance.
This is because electric utilities’ costs are driven not only by fuel consumption but also by the costs of building and maintaining a system that can meet the highest peaks. Variable rates are one-way; utilities incentivize companies to use energy during off-peak times. Similarly, demand-based charges penalize companies for large spikes in their energy use and for using energy during periods of grid stress.
These incentive structures are intended to reduce overall system costs, and in some cases, utilities or other parties provide email notifications of expected prices and events, but these are often difficult for industrial-scale operations to respond to with sufficient speed, and they can become difficult to manage for companies with many facilities across multiple territories.
During the baselining process, it is necessary to understand when rates are spiking or penalties are being applied. It may make sense to schedule maintenance during these times, or even shut down entirely. Enabling this kind of flexibility can help minimize capital costs. For example, refrigerated facilities can often be pre-cooled to curtail loads during peak times without affecting product quality or throughput.
In cases where throughput may be compromised, it is especially helpful to have real-time and production-normalized data to compare the expected benefits from curtailment with the expected costs of lost production.
By setting up a real-time data collection system, companies receive a much clearer picture of their usage patterns, such as on-shift versus off-shift usage. This helps flag areas for improvement. Large spikes in consumption can point the way to targeted improvements, whereas high usage across the board may point to a more capitalintensive strategy. Persistently higher demand during the first shift, for example, may be remedied by behavioral modifications that can be implemented at no cost.
Even utility meters with Advanced Metering Infrastructure (AMI) data are not always a good substitute for real-time monitoring systems. AMI systems, or “smart meters,” are typically installed by utilities to make meter reading easier, and they can provide data to energy users in 15-minute increments. This is far more granular than a monthly utility bill, but it may still be insufficient for effective energy management, primarily because of the lag time in receiving data.
Facilities looking for actionable information (e.g., to optimize processes or take advantage of load-shifting opportunities) typically find that they need even more granular and timely information. Thus, real-time data is necessary for operators to be proactive in driving down energy intensity and costs.
Submetering Specific Processes: The Most Impactful Way to Identify Energy-saving Opportunities
Most energy management systems monitor power usage at the main meter. This data should never be overlooked, but for industrial operations, it is not enough.
First, it is recommended to install a redundant meter alongside the utility’s meter. The reason is simple: billing errors can happen, and large energy users should double-check. A good meter can also uncover power factors and overvoltage issues that can cost money and damage equipment.
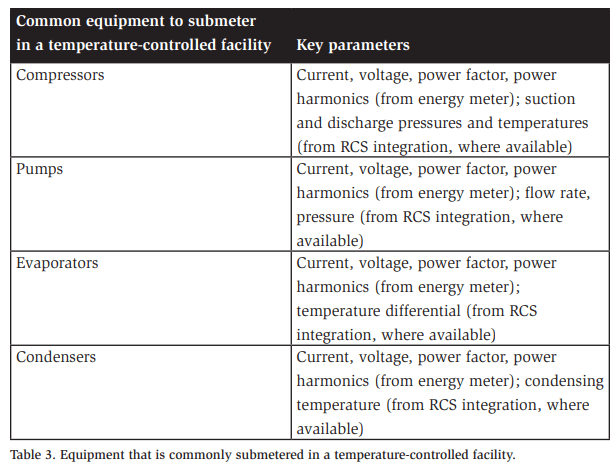
Then, it is useful to install submeters that monitor the most energy-intensive processes within a facility. Baselining specific systems, in addition to whole facilities, allows for a more targeted energy management approach. Baselining the realtime Coefficient of Performance of a refrigeration system, for example, enables true performance management at a level that operators can act on and be held accountable for.
It is important to note that when defining what to submeter, boundaries should be drawn around processes rather than equipment. For example, blast freezing involves not only the blast freezer unit but also the refrigeration system, the air circulation system, and the conveyors. Submetering should account for all major components involved in the process and feed into one or more of the metrics defined above, such as production-normalized energy intensity.
Furthermore, submetering projects must be scoped according to each company’s needs and budget, and consideration must be given to the systems that are already in place. Some existing meters and control systems are already IoT-enabled, and these should be leveraged wherever possible. In many cases, additional meters, sensors, and IoT gateways are required to transfer data to energy monitoring systems by way of industrial communications protocols, such as MODBUS.
Off-the-shelf hardware is available for most applications, but care must be taken to design a system that meets the needs of the project and creates an accessible and coordinated data repository. A fractured monitoring system that sends data to multiple places or in multiple formats can become burdensome to manage. Many energy monitoring and management systems are designed only for specific equipment, so it is important to consult vendors regarding interoperability and extensibility.
Interoperability is the capacity of a computer system or software to communicate directly with various systems. This is important because many systems are proprietary, meaning they only read data from certain devices (often only those manufactured by the creators of the software). Extensibility refers to a software system design that allows it to easily add new capabilities or integrations in the future. The energy management landscape is rapidly changing, and thus systems should be designed with flexibility in mind.
Creating a holistic monitoring system requires knowledge of energy management best practices, as well as a practical understanding of the equipment being monitored, the metering and IoT infrastructure, and the software design and configuration. Although some companies have all these skills, they are often siloed in multiple departments that are not accustomed to collaborating. Experienced partners can bring these competencies together and help bridge cultural gaps within the organization.
Conclusion and Discussion
Establishing an energy baseline can be done on almost any budget. A simple tally of utility bills can be an acceptable solution for companies looking to measure and report their consumption. However, this approach does not provide actionable information to help companies drive down costs and emissions, nor does it allow for robust comparisons or easy measurement and verification of the impact of energy conservation measures. To accomplish these goals, companies should define their performance metrics upfront, normalize the data in ways that make sense for their operations, set up realtime monitoring, and submeter specific processes.
Not all of these fundamentals must be followed in every case. The most appropriate approach may be different for each company and situation. Nevertheless, there are three main reasons to perform baselining correctly the first time:
- Usefulness
- Scalability
- Accessibility
A behind-the-meter data collection system with proper normalization is more useful than a tally of bills. It is not strictly required for establishing a baseline, but it sets companies up for success as they do the real work of driving down energy costs. It points the way to the highest-return investments and makes it easier to find and analyze best practices across a portfolio of facilities and assets.
A robust metering and monitoring system also saves cost and time in the future. Reporting becomes instantaneous, and new sites can easily be added without having to re-establish or re-normalize the baseline. The last thing companies want to do is scrap their baseline and start over each time a new facility is built or acquired.
Moreover, with a robust data collection system, primary-source data is accessible to anyone who needs it. This will become even more important for public companies – and anyone who does business with them – in an era of mandatory carbon disclosure. In particular, Scope 3 greenhouse gas reporting requirements will necessitate a new paradigm concerning data accessibility.
Scope 1 emissions are those generated on-site, such as the burning of natural gas and diesel. Scope 2 emissions are from procured electricity, and Scope 3 includes all the other life-cycle emissions an operation generates, ranging from supplier emissions to corporate air travel to downstream product use and disposal.
With the recent passage of California’s Climate Corporate Data Accountability Act, all large U.S. companies doing business in California are required to measure and report emissions across all three scopes. Similar laws recently passed in the European Union require full-scope emissions disclosure from all companies who do business in the EU.
This will require massive amounts of data collection and sharing. A well-defined energy monitoring system is necessary to distill these complex data streams into relevant and easily understandable metrics. Such a system may also enable valid comparisons among time periods, facilities, and companies. Finally, this system should enable granular analysis, troubleshooting, and optimization of energy consumption, without interrupting those who only need to see the bottom line.
References
Cisco. (23 May, 2017). “Cisco Survey Reveals Close to Three-Fourths of IoT Projects are Failing” [press release]. https://newsroom.cisco.com/c/r/newsroom/en/us/a/y2017/m05/cisco-survey-reveals-close-to-three-fourths-of-iot-projects-are-failing.html.
ENERGY STAR. (1 August, 2017). “Benchmarking Industrial Energy Performance.” https://www.energystar.gov/buildings/tools-and-resources/benchmarking_industrial_ energy_performance.
Ernest Orlando Lawrence Berkeley National Laboratory. (July 2013). Assessing theCosts and Benefits of the Superior Energy Performance Program. https://www.energy.gov/eere/amo/articles/assessing-costs-and-benefits-superior-energy-performanceprogram.
Science-Based Targets Initiative. (n.d.). FAQs. “Information About the SBTi and Science-Based Targets.” https://sciencebasedtargets.org/faqs#pandemic-reportingguidance.
U.S. Environmental Protection Agency. (14 February, 2023). “Scope 3 Inventory Guidance.” https://www.epa.gov/climateleadership/scope-3-inventory-guidance.