


2024 Technical Paper #12
Carrots to Sticks – Carbon Tracking for Cold Storage
Abstract
This paper provides an overview on the basics of carbon counting and how they may apply to carbon counting within the cold storage industry. It will also cover opportunities to take advantage of newer technologies available to improve the accuracy of carbon reporting data, and the ability to generate reports for your customers as part of their sustainability goals.
The following topics will be covered:
- Why track carbon now? – Justification for developing a carbon tracking program before it is required by regulation.
- Carbon counting basics – Terms used, key concepts and calculation methods.
- Regional emissions data – Traditional and real-time data sources.
- Scope 1, 2 and 3 Emissions – Definitions and sample calculations.
- Carbon counting in the cold storage industry.
- CO2-reporting challenges.
- Best practices, challenges, and rewards.
The goal of this paper is for readers to gain a basic understanding of the topics listed above areas and have clear path on the next steps needed to define their carbon counting strategies:
- Educate others on the status of carbon counting in the cold storage industry.
- Relate energy used in different areas of the facility to carbon counting categories.
- Quantify energy efficiency kWh savings to carbon avoidance values. • Develop a carbon tracking and reporting strategy
Introduction
When it comes to sustainability goals and regulations, eventually all carrots will become sticks!
At the current time, carbon counting requirements within the cold storage industry are mostly voluntary. Many companies have made the decision to take a proactive approach and perform the groundwork to develop a carbon counting strategy in anticipation of being mandated by local, state, or federal requirements. This includes implementing measures that make sense act as soon as possible, including the following actions:
- Low cost/no-cost measures to reduce energy usage and carbon emissions.
- Capital projects that make good economic sense from the energy savings alone.
- Carbon tracking as part of customer retention.
Decision makers must consider if they want to be proactive and experiment with carbon tracking while it is still voluntary or wait until they are mandated to do so. It appears this time is rapidly approaching when we look at how the European market has responded to the challenge of meeting the carbon reductions agreed to in the 2015 Paris Agreement, which is a legally binding international treaty on climate change. The U.S. is not far behind, with some jurisdictions seeing the development of a similar carbon trading market, as well as some penalties already being enforced for non-compliance at regional levels.
Carbon Counting Basics – Why are we even counting carbon?
The term “carbon footprint” came from the concept of an “ecological footprint,” which was developed in the early 1990s at the University of British Columbia.
This “ecological footprint” calculated the demands an activity had on the ecosystem to help businesses, governments, and institutions monitor resource use and advance sustainable development.
This concept did not get much notice until the early 2000s, when the oil company BP used the term “carbon counting” as part of a campaign to rebrand itself as an environmentally friendly company. This was basically a “greenwashing” campaign using the slogan “It’s time to go on a carbon diet” and included the world’s first carbon footprint calculator.
Carbon Counting Is Showing Up Everywhere
Carbon counting is now showing up in numerous industries. A good example of this is how airlines are starting to post the carbon consumed for every flight, as shown in Figure 1.
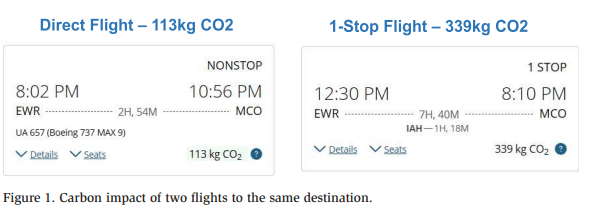
Notice that the direct flight uses one-third of the carbon as the flight with a connection. Will it someday be possible to justify the extra cost of the direct flight due to the carbon savings?
There are also companies that now require employees to purchase carbon offsets for every flight booked. This can be done through various online companies that provide calculators and a store to purchasing offsets. User can enter either the total travel time of the flight, or the amount of CO2 produced, if known. A typical cost is $16.49/ Ton, or $.0.1649/kg of CO2.
Counting Carbon in the Food Supply Chain
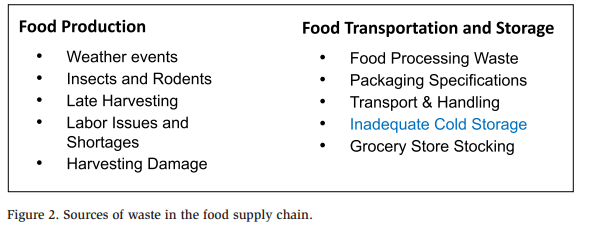
The carbon resulting from food waste has also been getting more attention lately. Studies have estimated that 30%-40% of all food produced is lost at some point in the supply chain. The sources of these losses are summarized in Figure 2.
The cost of investing in new technologies and resources to eliminate food waste could be much less than the cost the agricultural production required to replace lost food. carbon impact of replacing wasted food.
For every source of food waste listed above, actions can be taken to make reductions. These actions can range from better training on food handling to the enablement of new technologies to optimize food processing and reduce waste. For the cold storage industry, let’s focus on “Inadequate Cold Storage.” For this particular issue, it is estimated that 12% of all food produced is lost due to insufficient cold storage.
Savings can come from both the construction of new facilities to increase cold storage capacity as well as energy optimization at existing facilities to reduce their current carbon footprints. For cold storage facilities, CO2 is typically generated by two different emissions sources: Direct emissions and indirect emissions. Direct emissions are the result of actions taken at the site, like the burning of fuels to generate electricity or steam, as well as refrigerant leaks from onsite equipment. Indirect emissions are the result of emissions generated at the power plants that provide the electricity to operate the facility.
Counting Carbon in Your Meal Choices
Even at restaurants and at home, consumers can make meal choices based on their carbon impact. There are numerous websites that provide carbon counts for different foods. How soon before restaurant menus show it (Figure 3)?
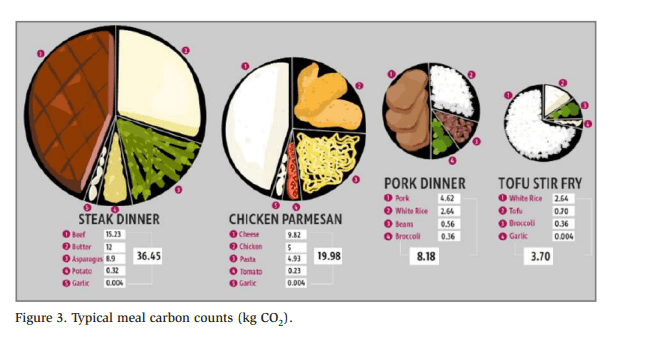
Note how the carbon count for a chicken dinner (19.8kg CO2) is about half that of a steak dinner, and a vegetarian tofu meal is about a tenth.
These numbers shown in the figure above for carbon counts are based on very rough estimates using industry data. We are also seeing certain manufacturers promoting sustainable methods that range from having renewable energy production onsite to cultivated meat production, so these numbers can also be very product specific. Manufacturers that promote sustainability will typically post carbon content for the foods they produce.
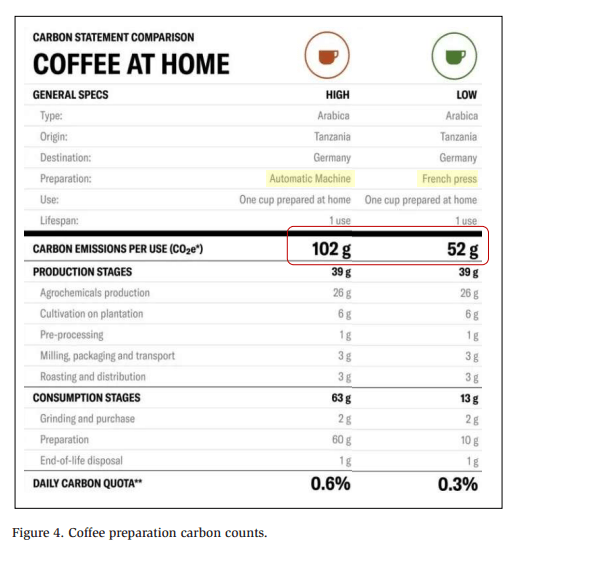
Processing Methods Matter
Even at home, the way consumers prepare and process food can have an impact. Figure 4 shows that using an automatic drip coffeemaker takes about twice the carbon of using a French press. It’s definitely more work for the consumer, but the coffee probably tastes better
The Improved Cold
Chain Why is the food cold chain an area of focus? Twelve percent of all food produced is lost due to insufficient storage. The cost and carbon impact of improving the food chain to eliminate waste could be much less than the cost of the agricultural production required to replace lost food.
For cold storage facilities, CO2 is typically generated from two different types of sources: Direct emissions and indirect emissions.
Direct emissions are the result of actions taken at the site, like the burning of fuels to generate electricity or steam, as well as refrigerant leaks from onsite equipment. Indirect emissions are the result of emission generated at the power plants that provide the electricity used by the facility.
Savings can come from both new construction to increase cold storage capacity as well as energy optimization at existing facilities.
Technological Advances in the Cold Chain
There are also some new technologies coming into the cold storage market that can help with the optimization of facility energy usage. This includes, but is not limited to, the following:
Thermal Storage – You don’t need a battery to store energy! This technology is already used to help cool large commercial buildings and is now available to the cold storage industry. Thermal storage systems can do this by using less expensive offpeak power to freeze blocks of engineered materials. This bank of cold materials can then be used to keep areas cool while equipment is turned down, or off during peak power periods. Think of your plastic cooler blocks on a much larger scale.
Advanced Sensors and Controls – Better data equals better decisions! There have also been many advances in wireless technology that allow cost-effective projects to monitor the status of cold room doors and take more temperature readings within the rooms themselves. Many of these systems also allow monitoring of data through a web-browser for remote alarming and reporting.
AI and Machine Learning – The future of optimization. There cold storage industry is on the edge of a new industrial revolution that is using new technology to created advanced refrigeration controls that leverage external data and physics-based machine learning to optimize facility operations. Automated processing of large amounts of data from multiple sources to better manage operations to reduce energy consumption by up to 40%. Imagine a software model of a facility where operational changes can be fully tested before being implemented at the facility.
Basic Carbon Counting Terms
Below is a listing of basic terms used as part of carbon tracking projects. Understanding these terms will provide a good foundation for understanding how carbon tracking applies to a given facility.
Greenhouse Gasses (GHGs) – Gases that trap heat in the atmosphere: Carbon dioxide (CO2), Methane (CH4), Nitrous oxide (N2O), Hydrofluorocarbons (HFCs), Perfluorocarbons (PFCs), Sulphur hexafluoride (SF6) and Nitrogen trifluoride (NF3).
CO2 – Carbon dioxide enters the atmosphere from burning fossil fuels and other materials. Also be a result of certain industrial chemical reactions (cement production). In the U.S., CO2 accounts for 75% of all the greenhouse gas emissions from human activities. This is why it gets the most focus. Generation of electricity is the second largest source of CO2 emissions in the U.S., accounting for 31% of total CO2 emissions.
CO2e – Used to describe the many different types of greenhouse gases in a single common unit of measurement based on the equivalent Carbon dioxide (CO2).
Green Power – The purchasing of renewable electricity credits to meet climate targets and sustainability claims.
Greenwashing – Companies spend more time and money on marketing themselves as environmentally friendly than actually minimizing their environmental impact.
Emissions Factor – A representative value that relates the quantity of a pollutant released to the atmosphere for a specific activity.
Fugitive Emissions – Gasses released into the air accidentally. For refrigerants, these often include HCFCs and HFCs (not ammonia).
Avoided Emissions – Savings from CO2 reduction projects. Includes energy efficiency and fuel switching.
SBTi (Science-based targets) – A global initiative with a clearly-defined path to reduce emissions in line with the 2015 Paris Agreement goals, which is a legally binding international treaty on climate change. More than 4,000 businesses around the world are already enrolled.
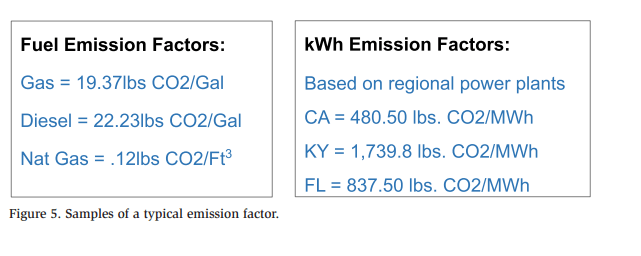
A Deeper Look into Emissions Factors
A solid understanding of emissions factors is key to carbon counting.
The main function of emissions factors is to relate fuel and electric consumption to carbon. For carbon calculations related fuel consumption, the resulting units are “lbs CO2/gal” for liquids or “lbs CO2/ft3 ” for gases. For carbon calculations related to electric consumption, the resulting units are “lbs CO2/kWh,” or for larger consumers like power plants, “lbs CO2/MWH.” The higher the emissions factor is, the higher the pollutants are from the source of energy production.
Figure 5 shows a few examples of typical emission factors.
Where Do Emission Factors Come From?
In the United States, emission factors have been historically managed by the EPA and published in a database known as eGRID, which stands for “Emissions and Generation Resource Integrated Database.” The is also an online interface to the eGRID database that allows users to browse all emissions data, which can be found at (https://www.epa.gov/egrid)
The eGRID database contains the environmental characteristics of almost all electric power generators in the United States. It is published every 1-2 years and is the most commonly accepted database for emissions data in the United States. The data provided includes emission rates, generation, heat input, resource mix, and other attributes. Data can be sorted by fuel type or GHG type and shown at the regional, sub-regional, state, and individual plant levels.
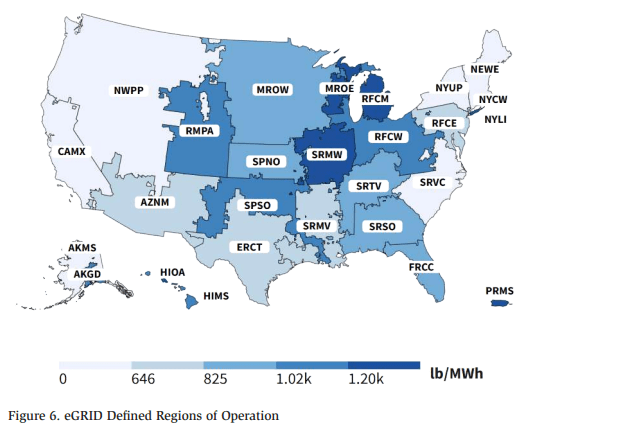
eGRID Regions
At the regional level, eGRID emission factors are segmented by defined areas that roughly follow the NERC (North American Electric Reliability Corporation) regions used to manage electric grid interconnection and reliability (Figure 6). Emission factors can vary widely with the current highest carbon emitting region being Hawaii (77% of power from burning mostly oil and coal) to the lowest carbon emitting current highes region being upstate NY (73% hydroelectric power).
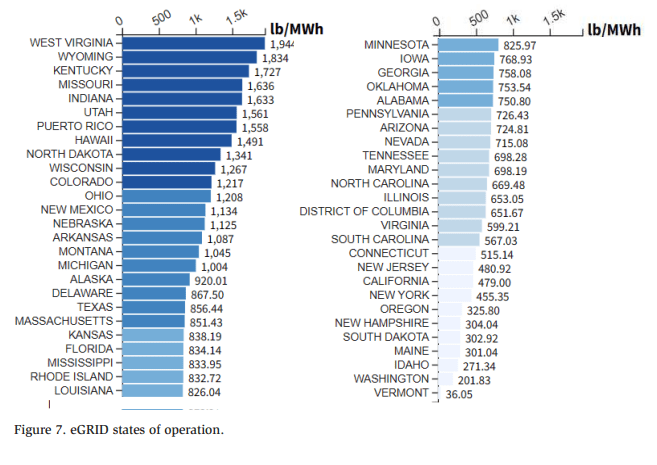
In addition to regional data, eGRID also publishes state emissions data (Figure 7). Similar to regions, state emissions factors vary widely with the current highest carbon emitting state being West Virginia (91% coal-fired power plants) to the lowest carbon emitting state being Vermont (almost 100% renewable energy in 2021).
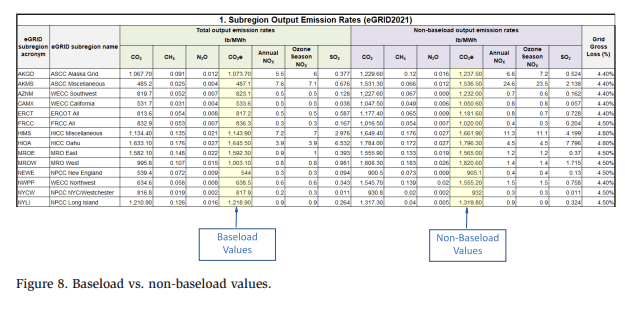
eGRID Baseload Designations
When viewing eGRID CO2 data, users will see a differentiation on numbers based on “Baseload” vs. “Non-Baseload” power plant operations. It is important to understand the difference between these two types of numbers.
Power plants that run at 100% capacity for baseload demand and have no extra capacity to contribute at other times are considered “baseload” facilities. This includes a majority of nuclear, hydro, solar, geothermal and wind generators.
Power plants that do not normally run at 100% capacity and have extra capacity to contribute at times of peak demand are considered “non-baseload” facilities. These are also sometimes referred to as “peak power plants” or “peaker plants.”
Since most energy efficiency projects are designed to avoid energy usage during the time when cost is highest, these types of projects will affect peak demand, not baseload demand. For this reason, the “non-baseload” emissions rates are used to calculate carbon output.
FIgure 8 shows that although these two numbers are close to each other, the nonbaseload numbers will always be slightly higher since these plants run at times of peak generation, which results in peak operational costs.
Realtime Emissions
Factors Technical advances have led to the availability of real-time emissions factors. In most cases, this means five-minute data updates, compared to a one-to-two-year delay before changes are made to the eGRID emissions data.
The companies providing this type of data are typically software-based and also provide APIs (Application Programming Interface) to allow the integration of this data into other software packages. These providers are also advocating a program called “The Open Grid Emissions Initiative” that is designed to fill a critical need for high-quality, publicly accessible, hourly grid emissions data that can be used for GHG accounting, policymaking, academic research, and energy attribute certificate markets.
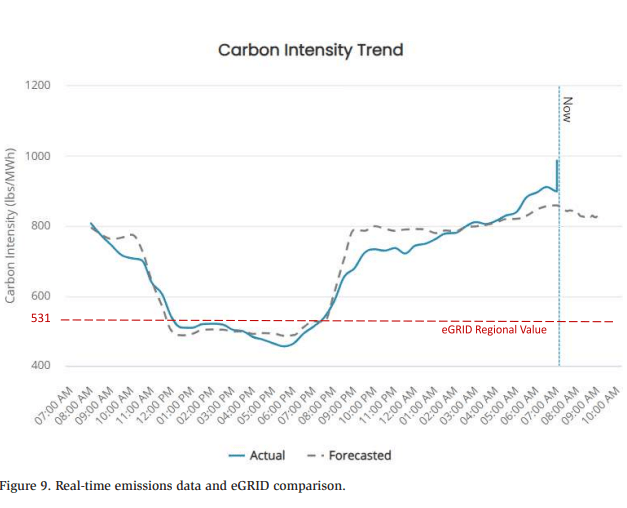
For each region, real-time data is trended at five-minute intervals. Carbon emissions data can be seen in a historical trend chart as well as a real-time generated fuel mix.
Figure 9 shows real-time data for the California CALISO region, which highlights the impact of solar production, or lack thereof, throughout the day. Having access to this data through a software API could allow end-user to modify their usage patterns to minimize their carbon footprint at times when the power is moving from “green to brown.”
Also note the line “eGRID Regional Value” added to the trend to show the difference between using eGRID data vs. real-time data for carbon calculations. With the static eGRID data, there is no opportunity to respond to actual changes from sustainable energy production or a change in operations at regional power plants.
Carbon Counting in the Cold Storage Industry
Larger, multi-site cold storage organizations are starting to take notice of carbon counting concepts. They are getting pressure from their Fortune 500 customers to provide carbon data for the products they are storing on their behalf, and realizing carbon counting may be important for customer retention.
An illustrative quote making this very clear was recently encountered during a discussion of project payback on a controls upgrade project:
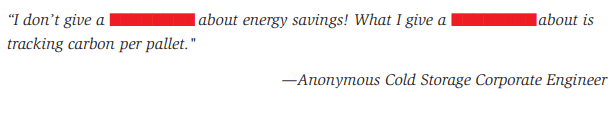
This shows some of the frustration of being tasked by senior executives to account for carbon across the facility and not having the resources to do so.
The First Step: Defining Reduction Targets
One question that can always be asked to gauge a company’s commitment to carbon reduction is “Have you committed to science-based targets?”
“Science based target” is a term created by the organization monitoring company’s commitments to the Paris Agreement to limit global warming. Participating companies are asked to commit to defining reduction levels, then have 24 months to develop a plan for reductions with actual target levels defined. This is a popular program in Europe and gaining ground in the U.S.
Why should any company do this? There is no direct financial compensation in the U.S. for now, but companies will run more efficiently in an effort to reduce carbon emissions and will also be recognized by their financial institutions and customers as committed to being a green organization.
Carbon Emissions Scopes – Scope 1, 2 and 3 Emissions
Carbon Emission Scopes are designations that segment carbon generation by facility function.
The terms “Scope 1, 2 and 3” come from the need to break down GHG emissions into different categories in order to facilitate the work of assessing a site’s overall carbon footprint.
Here are definitions for these three scopes:
Scope 1 Emissions – Emissions generated by a company/facility, such as burning natural gas, driving company cars, or refrigerant gas leaks.
Scope 2 Emissions – Emissions caused indirectly by consuming electricity and other energy that is generated outside a facility.
Scope 3 Emissions – Indirect emissions (also known as upstream/downstream value chain emissions) that occur from sources the company/facility does not own or control.
It is important to note that while a facility may not have any Scope 3 emissions, suppliers may have Scope 3 emissions that should be accounted for. A facility may also have Scope 3 emissions that its customers must account for. A company’s ability to provide details of any Scope 3 emissions to its customers may be a valuable resource that set them apart from the competition.
In addition, there may be a new scope on the horizon, Scope 4 emissions. These are “avoided emissions” that occur outside the value chain or life cycle of a product.
Measuring and reporting Scope 4 emissions is challenging due to the lack of universal standards and varying calculation methods and substantiated data is needed to support claims and avoid the appearance of greenwashing, so most companies are not yet focusing on this new designation.
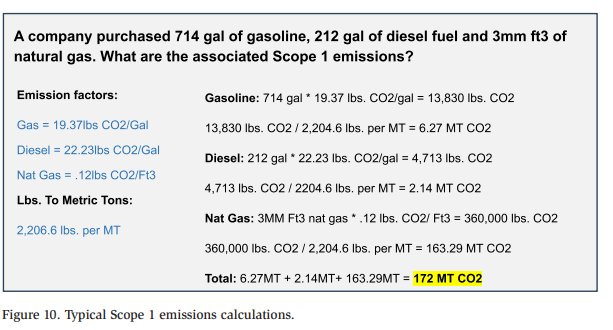
Scope 1 Calculations
Figure 10 shows an example of how Scope 1 emissions would typically be calculated for emissions generated at a facility:
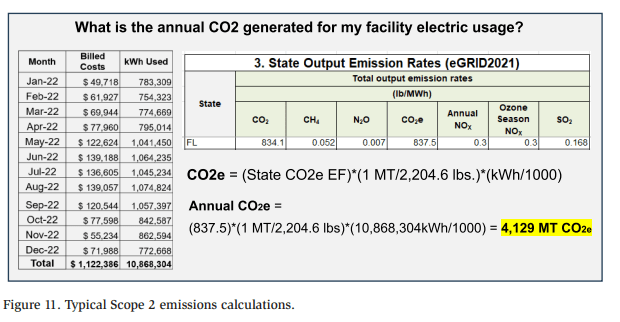
Scope 2 Calculations
Figure 11 provides an example of how Scope 2 emissions would typically be calculated for emissions generated at the regional power plants supplying electricity to a facility:
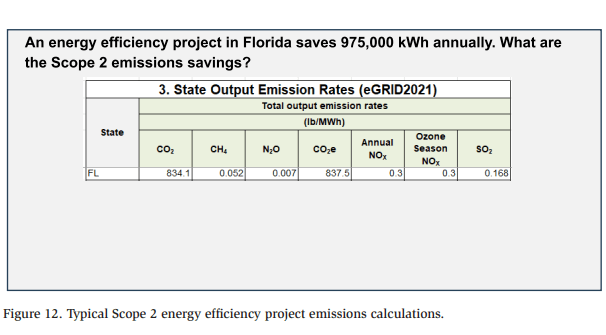
Scope 2 calculations may also include documenting the avoidance of emissions as a result of energy efficiency projects. For these cases, the kWh reduced will result in a reduction of CO2. Figure 12 offers an example of these types of calculations:
How do avoided emissions translate to cost savings? Beyond the kWh savings, if a company places a value on carbon there will also be carbon cost-savings. Figure 13 outlines a company that values carbon at $51.00/Metric Ton.
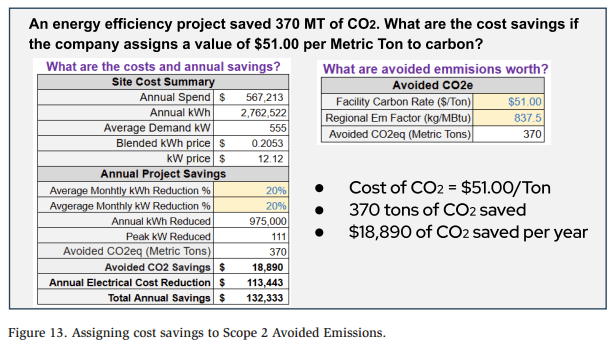
The markets for monetizing this reduction are still being developed in the US, but companies that are early adopters may still account for this and include it as part of the project ROI.
Scope 3 Calculations
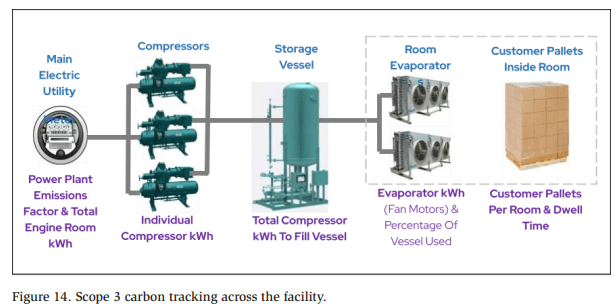
While valuable, Scope 3 emissions are very difficult to account for due to the level of tracking required throughout the facility. Basically, energy usage must be tracked as it is used across the facility. All energy related to customer product must be separated and converted to CO2.
It is also important to understand that Scope 3 emissions should not only include electricity use related to customer products, but also any electricity used to generate other types of energy used to handle, store or transport customer product. This includes ammonia for cooling and steam for keeping product warm while being stored in your warehouse.
For example, a refrigeration evaporator uses both electricity to run the fan as well as electricity to generate the ammonia running through the evaporator coils.
Figure 14 shows the type of electric sub-metering typically required to track Scope 3 carbon across the facility:
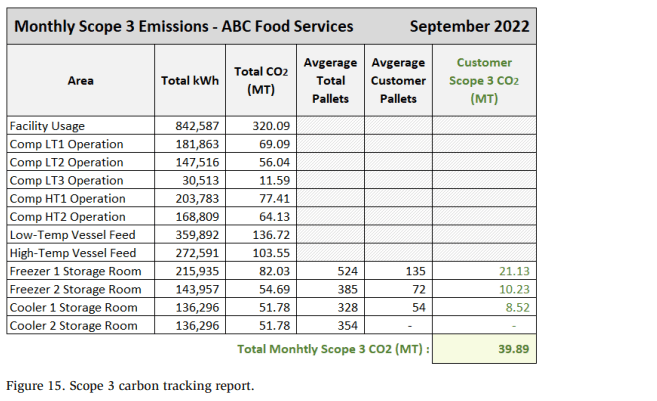
Once a Scope 3 tracking strategy is in place, the next step is to develop customer reports. A good Scope 3 report will include not only the total Scope 3 CO2 but will also show tracking of how the value was developed. This is important for customer accounting and validation of the data provided.
Figure 15 is an example of a detailed Scope 3 emissions report showing customer values and the supporting data for the calculations.
Carbon Tracking Best Practices
There are a few recommended best practices to follow when tracking carbon.
Leveraging the data generated by carbon tracking and reporting activities is also beneficial. This includes the following:
- Sub-meters for equipment energy usage
- Cold room door status
- Pallet counts and associated dwell times
- Battery charger status
- Emergency generator operation
- Real-time regional emissions factors
It is worth considering additional instrumentation to collect more granular data. One indirect benefit of doing this is the data collected may also be valuable for optimizing facility operations and maintaining product quality.
Carbon Tracking Challenges
Just like any other initiative, there will always be challenges. One very common problem in the cold storage industry is properly allocating energy across multiple customers sharing common storage space. Changes in product weight, location and time spent in the room can result in varying carbon calculations. Since tracking these differences between products would be time-consuming and nearly impossible to keep up with, it is recommended that a few assumptions be made to simplify the calculations.
- The weight difference between pallets is negligible.
- All pallets in the facility are handled or processed in a comparable fashion.
- Pallet duration time (dwell days) are averaged for the reporting period.
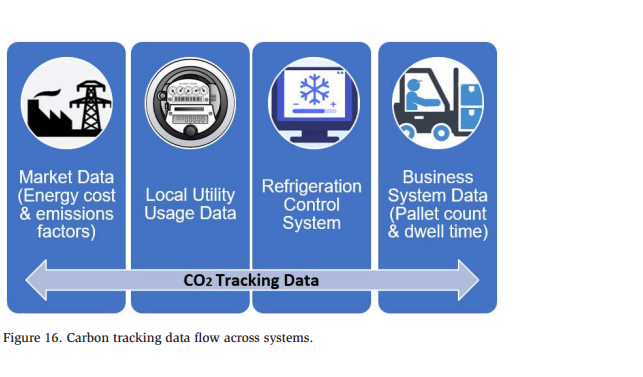
Another common problem in almost every industry is the sharing of data across multiple platforms (Figure 16). This will be a key part of carbon tracking and should be addressed as soon as possible to help define the scope of a carbon tracking project.
The ability to acquire external data and integrate it with in-house systems is valuable and worth the time and cost required to implement it. Combining data from the refrigeration control system with operational data from office systems is a critical part of delivering accurate Scope 3 reports.
Conclusion
The reward of implementing a successful carbon tracking project will be having a system that provides CO2 awareness across the facility. While in most cases, operational decisions will still be made based on cost savings, this will provide the opportunity to make the operational changes based on carbon savings as well.
As new regulations come into the market, a company with a robust carbon-tracking program will be well-prepared to respond to the requirements and not have to start from ground zero.
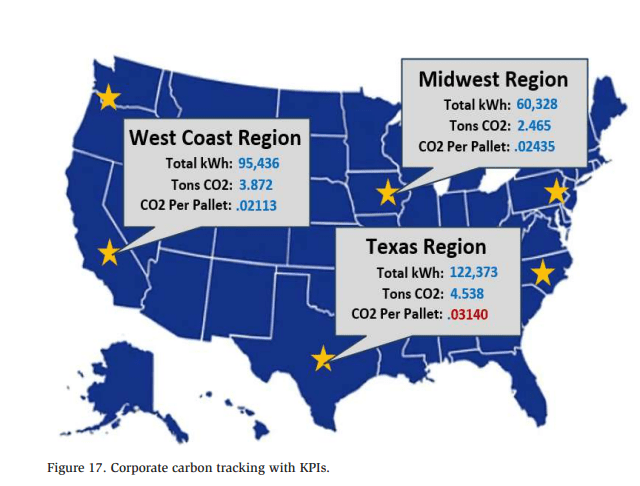
From a corporate perspective, if a carbon tracking project is rolled out to multiple sites, there is an opportunity to provide a corporate dashboard where data from multiple sites can be normalized and used for corporate monitoring, site-to-site comparisons, and reporting on regional reduction targets (Figure 17).