


2024 Technical Paper #11
Falling Film Chiller and Heat Pump Integration: An Energy-efficient Method for Producing Cold and Hot Water in a Dairy Plant
Author: José Augusto Castro Chagas, Castro Chagas Consulting Daniel Camps, Refrigeration AG German Robledo, GEA
Abstract
Decarbonization is a crucial process in the effort to mitigate the effects of climate change. Considering this aim, efficient energy utilization is also imperative for sustainable and cost-effective operations in dairy plants. In general, the refrigeration system rejects heat to the atmosphere on the condenser side, and the cooling and heating processes are performed separately, leading to energy waste and potential inefficiencies. Heating is typically provided using a boiler based on natural gas or other fossil fuels, which does not support decarbonization.
This study investigates the benefits of using integrated cooling and heating systems. An innovative approach is considered, combining a falling film chiller to generate water at 33 °F (0.5 °C) and a heat pump to simultaneously produce water at 194 °F (90 °C). The falling film chiller is more energy efficient compared with a traditional plate heat exchanger (PHE). The falling film design can produce water at near-freezing temperatures while working at higher evaporating temperatures than the PHE.
A heat pump not only produces hot water for pasteurization and other applications but also eliminates the need for a boiler that uses natural gas, thus enhancing the sustainability of dairy plant operations.
Introduction
First, we evaluate a milk production plant that processes 31,700 gallons (120,000 liters) per day of milk. This case study compares a traditional dairy plant using standard PHE and boiler systems with another design that produces cold water using a falling film chiller and hot water using a heat pump.
The study focuses on a dairy plant because of its intense energy usage with simultaneous cooling and heating load profiles. Furthermore, the potential decarbonization of a dairy plant is important to consider because an increase in population and affluence may also lead to an increase in dairy product consumption.
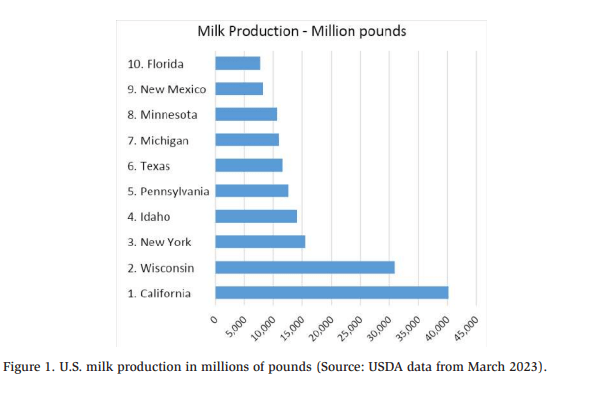
According to the data supplied by the United States Department of Agriculture (USDA) in March 2023, the total milk production in 2022 was 226,462 million gallons (857,270 million liters). Florida is the tenth largest milk producer in the U.S., with around 3.5% of the total output.
This study aims to examine and validate a sustainable design for a dairy plant that can be applied to other facilities and industries.
Sustainability
Sustainability is one of the most commonly used words in corporate marketing materials today. According to the Sustainability Guide from the International Society of Sustainability Professionals, the economist Hernan Daly defines sustainability with four operational principles:
- Human systems must be within the limits of the carrying capacity of natural systems.
- Technological progress requires increasing efficiency rather than throughput.
- Renewable resources cannot be driven to extinction (either by over-extracting or by emitting wastes that exceed the capacity of ecosystems to assimilate the emissions).
- Nonrenewable resources should only be used at a rate equal to or less than the rate at which substitutes are created. (reference)
The carrying capacity is “the maximum population that can survive indefinitely on the available resources and services.” This concept was initially described by Robert Malthus (1776–1834) and was adopted and expanded by many others. Currently, it is widely used to understand sustainable growth.
The most commonly used definition of sustainability is the one provided by the Brundtland Commission in the Report of the World Commission on Environment and Development: Our Common Future, and is also adopted by ASHRAE in the Guide for Sustainable Refrigerated Facilities and Refrigeration Systems:
“Providing the needs of the present without detracting from the ability to fulfill the needs of the future.” (ASHRAE 2018)
The IPAT equation is a conceptual model developed by Paul and Ann Ehrlich of Stanford University and is used to describe the relationship between the three main drivers of humanity’s impacts on Earth: population, affluence, and technology.
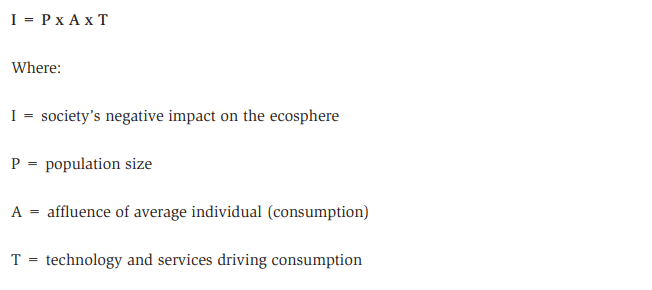
Based on this equation, the population size (P) and affluence of the average individual (A) directly affect the negative impacts of humans on the ecosphere, which exacerbates the climate change problem.
Population and affluence growth cannot be controlled, leaving technology and services driving consumption (T) as the only option to balance society’s negative impact on the ecosphere.
Net Zero, decarbonization, and energy efficiency are the key concepts and areas of improvement for refrigeration facilities and refrigeration professionals because they involve the major technologies through which we can improve the sustainability of industrial facilities.
Net Zero
The term Net Zero refers to the overall amount of greenhouse gas emissions, balancing the amount released into the atmosphere from sources with the amount removed and stored by carbon sinks. Typically, we consider the target to be Net Zero.
According to the Paris Agreement 2015, the world must reach Net Zero greenhouse gas emissions early in the second half of the present century. This will require the transformation of economies and societies alike.
Decarbonization
Decarbonization is the reduction or elimination of carbon dioxide (CO2) emissions from various sources to mitigate climate change and involves a transition to a more sustainable energy system. Decarbonization of industrial processes means looking for opportunities to reduce CO2 emissions in the industrial sector. Without burning fossil fuels onsite, most industries need to increase renewable energy and use electricity for water heating.
Many countries and corporations aim to achieve Net Zero goals by 2050.
Electrification
Conversion from fossil fuels to electricity is a decarbonization strategy. Electrification refers to the implementation of technologies, such as heat pumps, that operate using electricity instead of burning fossil fuels such as oil, gas, and coal. Generating electricity through clean resources, such as wind and solar power, is considered a decarbonization strategy. Industrial electric boilers use electricity to heat water or generate steam. Unlike gas boilers, electric boilers do not lose excess heat,minimizing the amount of wasted energy. Adopting all-electric boilers is considered an electrification strategy, driving decarbonization.
Notably, the maximum boiler efficiency is lower than 98%. Heat pumps can exceed 100% efficiency by using the wasted heat from the refrigeration system as a source of heating, which is leveraged as a decarbonization strategy in this study.
Energy Efficiency
Energy efficiency is a measure of the energy consumed or required to accomplish a defined amount of work.
Energy-efficient industries use less energy to heat, cool, and run processes and equipment; energy-efficient manufacturing facilities use less energy to produce goods. Enhancing energy efficiency is one of the easiest and most cost-effective ways to combat climate change and reduce energy costs. Increasing energy efficiency is also vital in achieving Net Zero CO2 emissions through decarbonization.
Opportunities for Decarbonization
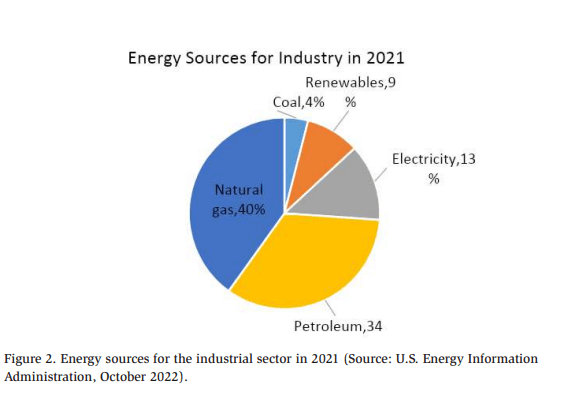
According to the U.S. Energy Information Administration, on average over the last 20 years, the industrial sector represents 45% of total energy consumption in the U.S. (excluding transportation), but electricity represents only 13% of the energy sources used in the industrial sector. Natural gas, petroleum, and coal represent 79% of the energy sources used in the industrial sector.
According to the U.S. Green Building Council: Chapter 8 – Energy & Atmosphere guidelines, the primary goals for decarbonization are:
- Reducing energy demand
- Increasing energy efficiency
- Replacing fossil fuels with renewable energy
- Eliminating the use of harmful refrigerants
- Monitoring ongoing performance
In 2019, industrial consumers used 8,417.3 billion cubic feet (238.4 billion cubic meters) of natural gas in the United States, representing 50% of total consumers. This is because natural gas boilers are generally cheaper to operate than oil-burning boilers. Natural gas also costs less and is more efficient than oil.
Some states and regions with top milk producers – like California and the Northeast – are pushing to ban natural gas usage. Although the ban is not an immediate issue for the country because it will not be implemented suddenly, it is essential to give industrial consumers energy-efficient options, without resorting to fossil fuels.
Milk Production Case Study
This study evaluates a milk production plant that processes 31,700 gallons daily (120,000 liters daily). The actual cooling and heating demands from an existing plant are considered and used as a comparison with a hypothetical operation in Florida.
This case study compares two different designs. First is a traditional dairy solution plant using a standard plate heat exchanger (PHE) and a natural gas boiler heating system. Second is an integrated ammonia (NH3) system that produces cold water using a falling film chiller and produces hot water using a heat pump. This integrated design also considers an ice storage system, accumulating ice during off-peak hours, and a solar photovoltaic system, producing electricity during the on-peak period.
According to the 2022 ASHRAE Handbook – Refrigeration (IP), milk is defined in the U.S. Code of Federal Regulations and the Grade A Pasteurized Milk Ordinance (PMO). Most dairy farms have bulk tanks to receive milk, and the PMO requires a tank to have a cooling capacity to achieve 50°F (10°C) or less within 4 hours of the first milking and 45°F (7°C) or less within 2 hours after the completion of milking.
The most commonly used refrigerant in dairy plants is NH3. Cooling can be achieved using either direct NH3 systems or indirect systems supplemented with water or propylene glycol. The direct system must be carefully applied to prevent milk from freezing on the lining. This limits the evaporator temperature to approximately 25°F (−4°C) to 28°F (−2°C).
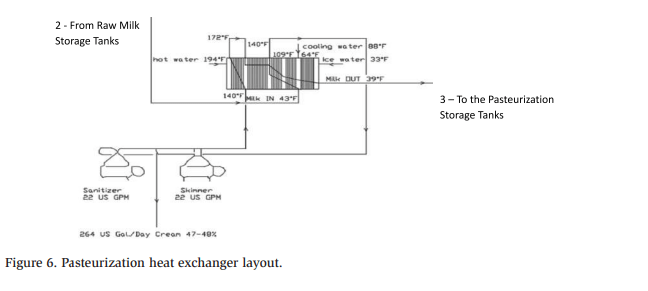
The dairy plant in this case study receives milk during the day, as follows:
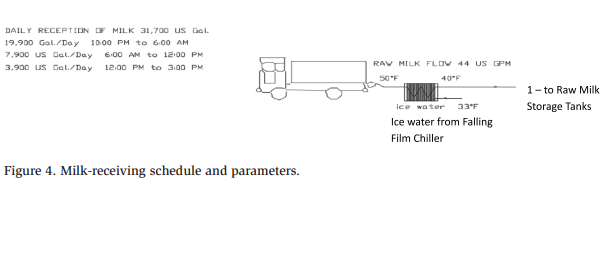
The raw milk is cooled before being delivered to the storage tanks. The required temperature to cool milk in a dairy processing plant can vary depending on regulations, product requirements, and processing methods. A standard industry practice is to cool milk to a temperature of 39°F (4°C) or lower as quickly as possible after milking to inhibit the growth of harmful bacteria. Low temperature helps preserve both the quality of milk and the desired flavor.
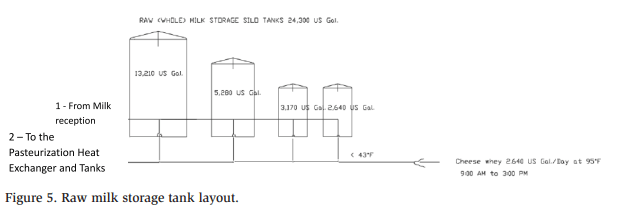
After cooling, the raw milk is stored in four tanks (24,300 gallons combined) before undergoing the pasteurization process in a high-temperature short-time (HTST) heat exchanger. Ice water at 33°F (0.5°C) and heating water at 194°F (90°C) are provided for continuous pasteurization at 176°F (78°C).
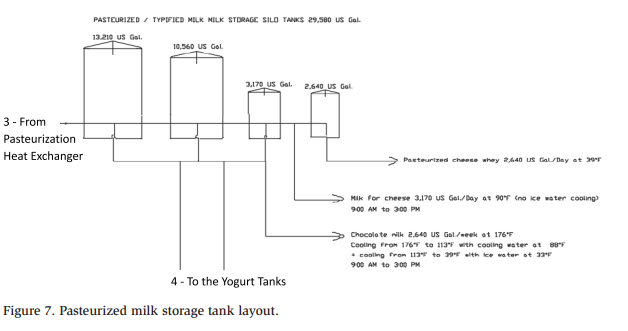
After pasteurization, the processed milk is stored in silo tanks and distributed to other processes, including cheese, chocolate milk, and yogurt production.
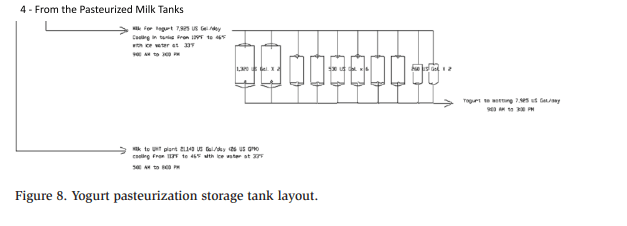
Finally, the plant has milk cooling tanks for yogurt production.
Pasteurized Milk For Processed Products
Cheese – 3,170 gallons/day
Pasteurized milk at 90°F (32°C) is heated to 162°F (72°C) using hot water and then cooled to 109°F (43°C) using cooling water. Ferments and rennet are added and cut with the lyre, then discharged to the pre-press, completing the process.
The cheese vats receive two charges per day, with a 3.5-hour cycle each. The curd is separated from the whey in the pre-press, which goes to the molding tables and is then pressed into the molds with compressed air, obtaining 2,640 gallons (2,400 lb) of cheese per day. The whey is pasteurized and chilled using ice water from 109 °F (43°C) to 39°F (4°C) for reuse in the plant.
Then, the cheeses are unmolded, immersed in brine (NaCl) for 24 hours, and maintained at 54°F (12°C) using a PHE with 30,000 BTUH.
On the next day, they are removed and stored in ripening chambers at 54°F (12°C) and 85% R.H. with air velocities of 50 FPM, losing 1% moisture by weight in the first day, 1% in the next seven days, and 5%–6% in the next three to six months of maturation. Maintaining this process for at least 90 days of production (216 tons), which standardizes the sensible and latent thermal demand, results in a total of 180,000 BTU/h.
Operation: 9:00 AM to 3:00 PM
Chocolate Milk – 2,460 gallons/week
Heating from 43°F (6°C) to 176°F (80°C) is accomplished using hot water. Cooling from 176°F (80°C to 113°F (45°C) is accomplished using cooling water at 88°F (31°C) and from 113°F (45°C) to 39°F (4°C) using ice water at 33°F (0.5°C).
Operation: 9:00 AM to 3:00 PM
Yogurt – 7,925 gallons/day
Milk for natural yogurt is heated in tanks from 43°F (6°C) to 109 °F (43°C) using hot water and cooled down from 109 °F (43°C) to 46 °F (8°C) using ice water at 33°F (0.5°C).
After fermenting in tanks for one day, drinkable yogurt types are fed to a steamheated high-temperature pasteurizer and a high-pressure homogenizer, before going to packaging.
Operation: 9:00 AM to 3:00 PM
Ultra-High Temperature (UHT) Milk – 21,140 gallons/day
The milk plant is heated using steam at ultra-high temperatures to increase shelf life, which was not considered in this study, as it is a sterilized independent whole plant (*).
Operation: 5:00 AM to 8:00 PM
System Design
It is well known that direct systems have an energy efficiency advantage, achieving cooling goals using higher evaporation temperatures compared with indirect systems. Overall, the direct system has the lowest operational cost among the options. The disadvantages are the higher NH3 charge, the risk of freezing, and the increased risk of food contamination in the case of refrigerant leakage.
Indirect systems are preferable to minimize risks to the product and reduce the NH3 charge. However, indirect systems typically have higher operational costs owing to the losses associated with the heat transfer to a secondary coolant.
PHEs are commonly used in dairy plants for heat transfer applications, such as cooling and pasteurizing milk, cream, yogurt, and cheese. Some plants use propylene glycol from 28°F (−2°C) to 30°F (−1°C) for process cooling requirements. Although it is still common, using glycol as a cooling medium for milk is discouraged or restricted in many processing applications.
Any glycol, while effective as a coolant, can harm the flavor and quality of dairy products, even in the case of trace amounts of leakage. Most countries also have strict regulations and standards for food safety and dairy processing to avoid crosscontamination.
Chilled water is the safest secondary coolant in areas not affected by extreme winter temperatures. If chilled water is used, it must be supplied at 33°F (0.5°C) to 34°F (1°C) to cool the milk at 39°F (4°C). It can be produced using ice banks or falling film chillers. This study considers milk cooling from 86°F (30°C) to 39°F (4°C).
The falling film chillers, compressors, and heat pumps considered for this study are named to help provide a reference for the data used in the calculations. This study focuses on the opportunity for decarbonization by integrating heating and cooling, and similar results can be obtained with other brands.
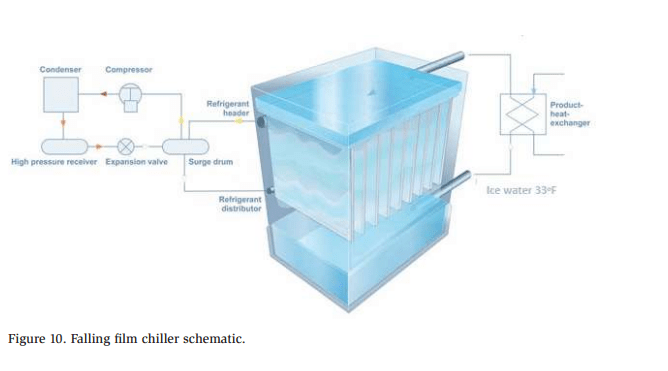
Falling Film Chillers
Falling film chillers use a thin film of liquid refrigerant flowing over a heat exchange surface. Heat is transferred from the process fluid (water) to the refrigerant as it flows down the surface. The falling film chiller has a high heat transfer coefficient of 352.45 BTUH/ft2 °F (2,000 W/m2 K). This efficiency ensures that milk is rapidly cooled to the desired temperature, preserving its quality and safety.
These chillers can rapidly cool large quantities of water, which is essential for quickly cooling large milk volumes. Their compact design also makes them suitable for dairy processing plants where space is often limited, and they are designed for easy cleaning and maintenance, meeting the stringent hygiene requirements of the dairy industry. For the cooling process, falling film chillers can lead to long-term cost savings in energy consumption. In this study, a BWP falling film chiller is considered, using 4,852 MBTUH (1,423 kW) to cool milk at 33°F (0.5°C) without the risk of freezing.
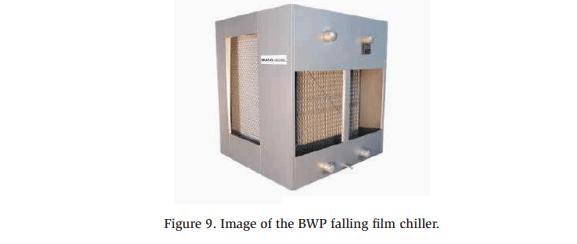
The falling film chiller is connected to the NH3 system at 27°F (−3°C).
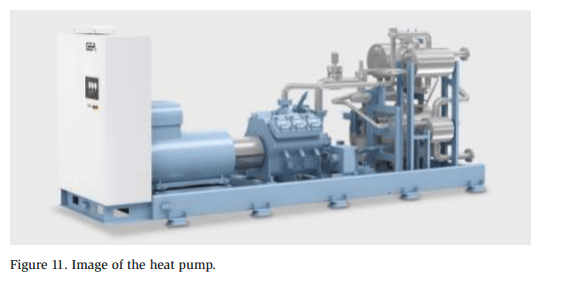
Heat Pump
For the heating process, boilers are widely used. Replacing a traditional boiler with a heat pump in a dairy plant can offer significant benefits in terms of decarbonization. The reduction of CO2 emissions is the primary goal. However, energy efficiency is also a critical factor. Electric boilers are also a workable solution for electrification, but even the most efficient designs have efficiencies lower than 100% and a COP of 0.95. In contrast, heat pumps are more efficient and can significantly reduce energy consumption compared with boilers, with COP values above 4, owing to the captured energy in the heat source.
In the present example, the heat pump transfers heat from the captured refrigeration heat to the dairy plant’s hot water system, which can result in substantial cost savings on energy bills. Integrating heating and cooling, the waste heat generated in the refrigeration process can be used as the source heat for the heat pump.
Heat pumps are a sustainable alternative to boilers because they have less carbon emissions. By using electricity to move heat rather than generating heat through combustion, heat pumps can help reduce the dairy plant’s carbon footprint and contribute to environmental sustainability. Thus, replacing a boiler with a heat pump reduces the dairy plant’s reliance on fossil fuels, such as natural gas or oil. This can lead to greater energy independence and reduce vulnerability to fuel price fluctuations.
Unsworth and Hoffman explained the advantages of using heat pumps in their technical paper Ammonia Heat Pumps Helping to De-Carbonize Food and Beverage Industries, published by the Institute of Refrigeration in 2022. Another useful reference is Add On Heat Pump for Dairy Application, reported by Unsworth, Vermeer, and Gerritsen.
The current study uses two heat pumps, each with 1,774 MBTUH (520 kW) of heating capacity and a piston compressor to heat water at 194 °F (90 °C).
The heat source is the refrigeration system, and the heating loads occur at the same time as the cooling loads. The system has a buffer tank to avoid load fluctuations. However, the peak cooling and heating loads occur during the on-peak hours, which increases the kWh cost.
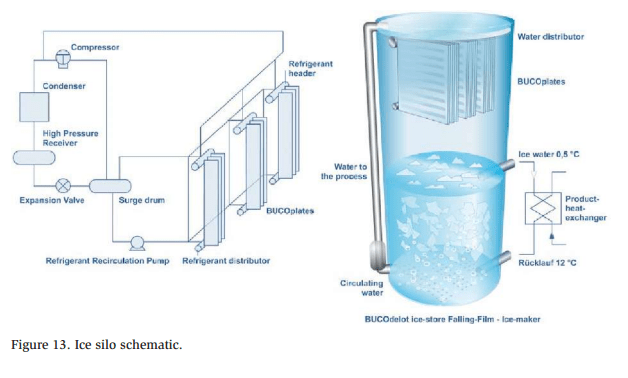
Ice Storage and Silo
To avoid the lower demand in the off-peak period and the high demand at on-peak hours, the dairy plant has an ice-making system that generates 42 tons of ice and operates 17 hours daily. It requires 3,885 kWh and has a silo for ice storage.
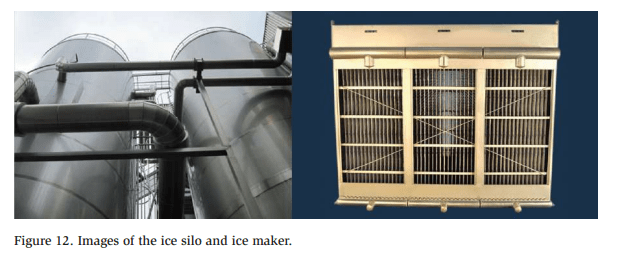
ice, which maintains the heat conductivity at a low level. After several minutes of building up ice, an automatic PLC system signals for hot gas injection to the heat exchange panel for several Figure 12. Images of the ice silo and ice maker. Ice is frozen on vertical evaporator panels and forms a 0.236–0.315 inch (6–8 mm) thin layer of ice, which maintains the heat conductivity at a low level. After several minutes of building up ice, an automatic PLC system signals for hot gas injection to the heat exchange panel for several seconds to split off the ice. After that, the evaporator is free again to form another thin layer of ice.
The ice maker is connected at 14°F (−10°C), which is considered an energy efficiency advantage. The average cost is $151 per day to produce 42 tons of ice, almost half of the cost of a drum ice maker working at −22°F (−30°C).
Finally, the dairy plant has a 322 kW PV solar system to generate electricity during on-peak periods.
Moreover, governments and utility companies offer incentives, rebates, and tax credits to install energy-efficient heat pump systems and other energy-efficient technologies. These financial incentives can help offset the initial investment.
This study considers the following energy efficiency benefits:
- Uses a falling chiller for cooling chilled water at higher evaporation temperatures.
- Uses a heat pump for heating water, exploiting the recovered heat from the refrigeration system
- Uses ice-making to produce and store ice during the off-peak period.
- Uses a solar system to produce electricity during on-peak periods.
Together, all these benefits help to minimize the dairy plant’s carbon footprint.
Cooling and Heating Loads
Here is a summary of cooling and heating loads in the dairy plant:
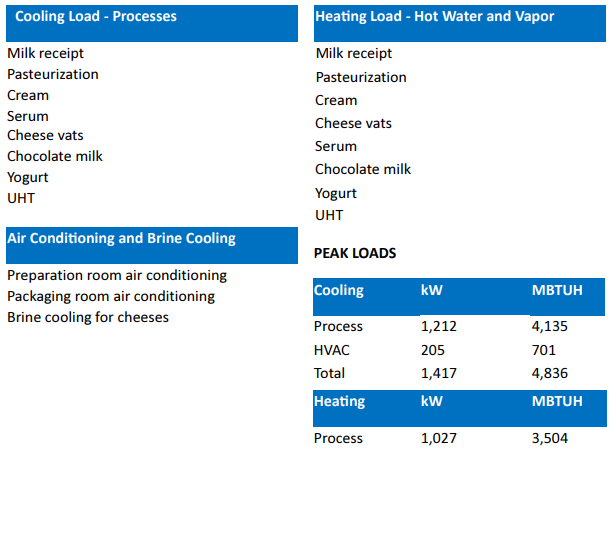
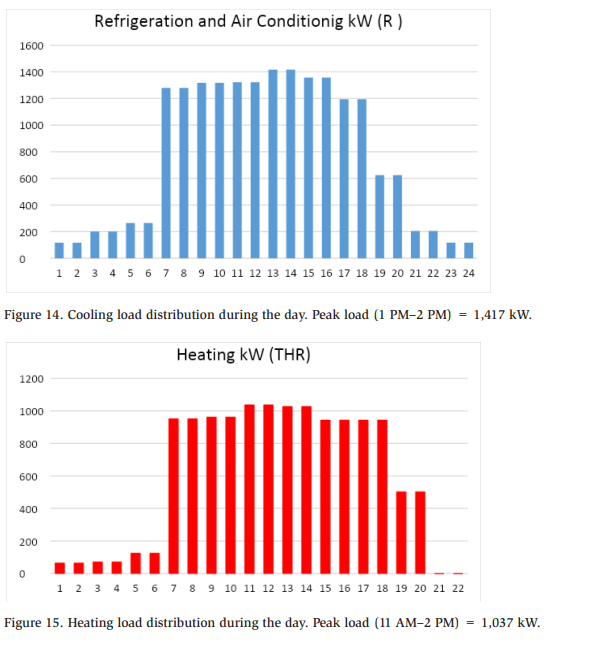
Figures 14 and 15 show the day’s cooling and heating load distribution.
The heating load includes milk pasteurization. The pasteurization process varies from country to country and plant to plant. This study considers a milk pasteurization temperature of 176°F (78°C) for 15 to 20 seconds.
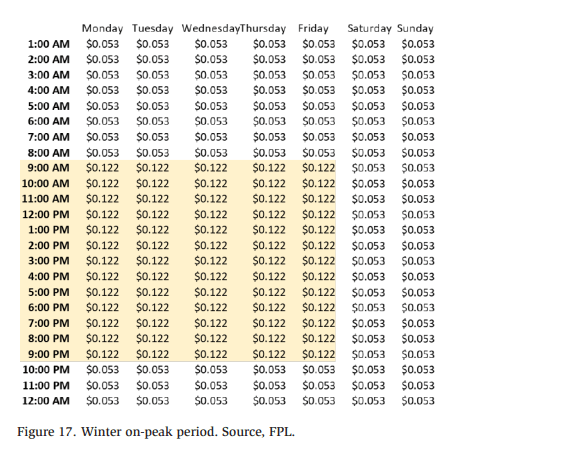
The cooling and heating peak loads coincide during the day and occur during the on-peak period. The TOU rates, based on the Florida Power Light (FPL) kWh rates for industrial customers as of April 2023, are:
On-peak Period
- Summer (June – September): $0.16457 per kWh (3:00 PM to 7:00 PM, Monday through Friday)
- Winter (October – May): $0.12178 per kWh (10:00 AM to 9:00 PM, Monday through Friday)
Off-peak Period
- Summer (June – September): $0.06596 per kWh (7:00 PM to 3:00 PM, Monday through Friday, and all day Saturday and Sunday)
- Winter (October – May): $0.05318 per kWh (9:00 PM to 10:00 AM, Monday through Friday, and all day Saturday and Sunday)
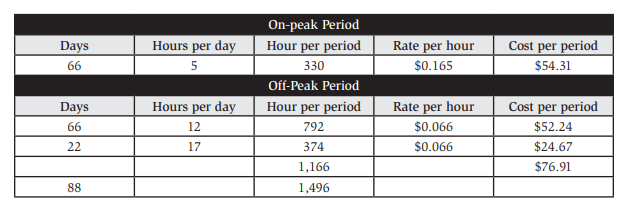
Considering the summer period from June 1 to September 30, with 66 workdays and 22 weekends in this period, the dairy plant has the following costs per period:

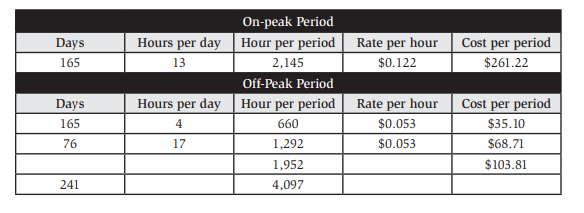
For the winter period, from October 1 to May 31, and 165 workdays and 76 weekends, we have the following costs per period:
a) Summer
- On-peak: 330 hours
- Off-peak: 1,166 hours
- Total: 1,496 hours
b) Winter
- On-peak: 2,145 hours
- Off-peak: 1,952 hours
- Total: 4,097 hours
c) Summer and Winter
- On-peak: 2,475 hours
- Off-peak: 3,118 hours
- Total: 5,593 hours
Option 1 – Traditional Solution using a PHE for Cooling and a Boiler for Heating
The cooling load has a refrigeration capacity of 4,855 MBTUH (1,423 kW), producing glycol water solution at 28°F (−2°C) using a PHE heat exchanger. The condensing and evaporating temperatures are 23°F and 95°F (−5°C and 35°C). The water temperature for cooling milk is 36°F (2°C). All heating loads are performed using the boiler burning natural gas.
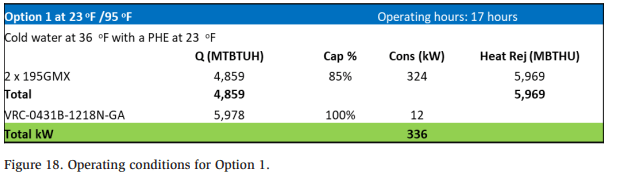
This condition is calculated considering a single-stage NH3 system. The total heat rejection is 5,764 MBTUH (1,689 kW), delivered to the atmosphere as waste heat.
Natural gas is the most commonly used fuel for industrial boilers. Natural gas has gained significant popularity in recent years because of its abundant availability and relatively low cost. Regarding boiler efficiency, natural gas offers undeniable advantages compared with other traditional fuel sources, such as coal or oil.
Industrial boilers fueled by natural gas can achieve up to 98% efficiency in newer high-efficiency gas boilers.
The annual fuel utilization efficiency (AFUE), which is a measure of thermal efficiency, is defined in ASHRAE Standard 103.
Although the average industrial boiler efficiency ranges between 80% and 85% using natural gas, to estimate the carbon footprint, we consider a boiler with 95% efficiency and a heating capacity of around 3.686 MBTHU (1,081 kW) to meet the heating demand. This boiler efficiency is relatively high for the market, and the carbon footprint is higher for low-efficiency boilers. The CO2 generated by burning natural gas is 0.407 lb of CO2e per kWh or 120 lb of CO2e per millions of BTU. Considering 5,593 hours of operation per year, the carbon emissions can be calculated as follows:
- 6,046,327 kWh x 0.407 = 2,460,855 lb of CO2e per year
- 20,618 million BTUH x 120 = 2,474,156 lb of CO2e per year
Both calculations provide a similar result; we consider the smaller value in this study.
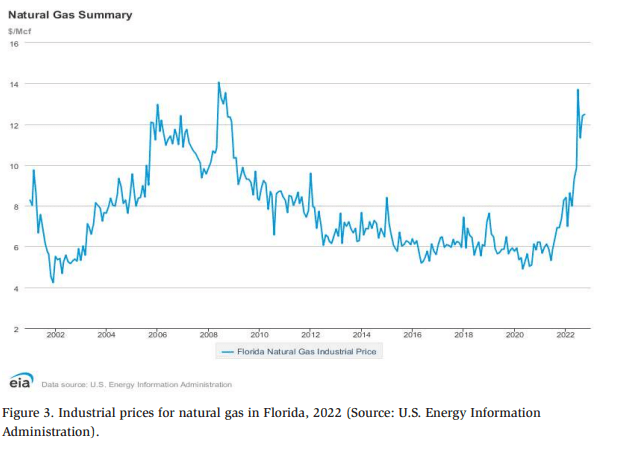
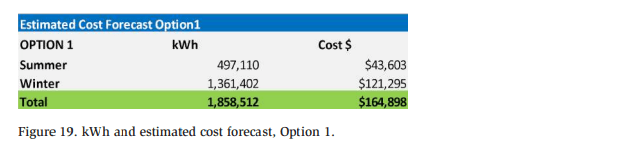
Natural gas consumption is approximately 1.8 million cubic feet, with a rough estimate of $109,000 annually.
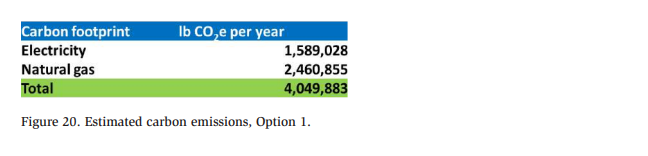
For this calculation, we consider 0.885 lb of CO2e per kWh per year for electricity as a U.S. average, as reported by the U.S. Energy Information Administration.
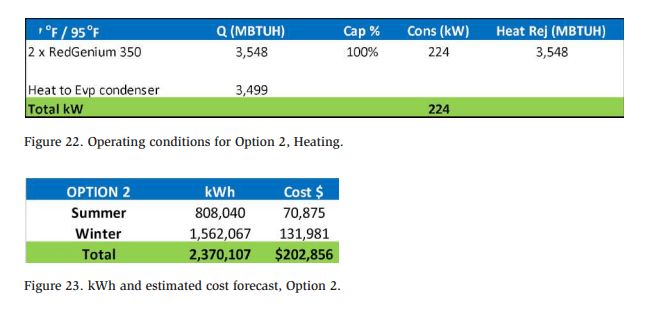
Option 2 – Integrated Solution using a Falling Film Chiller and a Heat Pump
The proposed plant produces cold water at 33°F (0.5°C) using a falling film chiller, evaporating at 27°F (−3°C) to directly cover the process cooling demand and air conditioning systems. The heating demand (except for general cleaning and personnel services) is covered by heat recovery from the compressor hot gas discharge and a high-pressure compressor heat pump.
Hot water is accumulated in a buffer tank to cover the needs during peak hours and is mixed to reach temperatures between 113°F (45°C) and 194°F (90°C) for other services. Ice is produced using an ice maker working with NH3 at an evaporation temperature of 14°F (−10°C). In this case, the ice silo accumulates energy during the off-peak time for the cooling and air conditioning systems.
Cooling Demand
-
- 01 Falling film chiller
- Capacity: 4,855 MBTUH (1,423 kW)
- Inlet temperature: 42°F (5.8°C)
- Outlet temperature: 33°F (0.5°C)
- Evaporation temperature: 27°F (−3°C)
- 01 Ice maker with 42 tons per day of ice
- Capacity: 870 MBTUH (255 kW)
- Working hours: 17 hours
- Inlet temperature: 33°F (0.5°C)
- Evaporation temperature: 14°F (−10°C)
- 02 Compressors: 4,881 MBTUH (1,431 kW) @ 27°F/95 °F (−3°C/35°C) • 01 Compressor 885 MBTUH (259 kW) @ 14°F/95°F (−10°C/35°C)
- 01 Falling film chiller
- 1 x adiabatic evaporative condenser Trillium TSDC2-SS-313-37.2 with 3.499 MBTUH (1,026 kW), which uses water only when needed
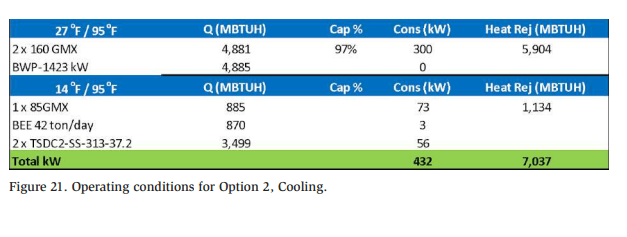
Heating Demand
- Total heat rejection: 7,037 MBTUH (2,063 kW) @ 95 °F (35°C) dry bulb
- Two heat pumps 1,774 MBTUH (520 kW) high-efficiency liquid NH3 heat pumps with piston compressors and equipped with a variable speed drive
- Heat recovered by heat pumps: 3,546 MBTUH (1,040 kW)
- Evaporative condenser required capacity: 3,499 MBTUH (1,026 kW)
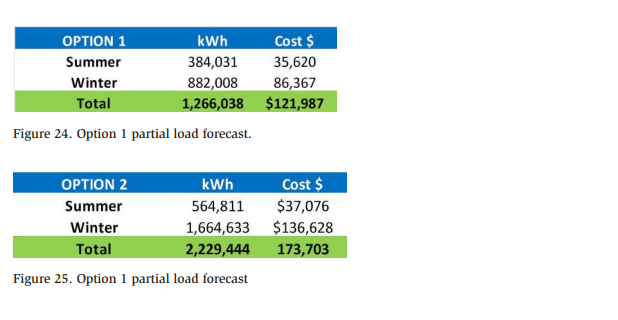
In-depth analyses of the partial load performance for both options result in the following kWh and cost estimations.
Decarbonization
When discussing decarbonization, we are willing to reduce the carbon emissions from different sources.
Scope 1 covers emissions from sources that an organization owns or directly controls– for example, from burning fuel in boilers (if they are not electrically powered). Scope 2 refers to emissions that a company causes indirectly and come from where the energy is purchased and produced. Scope 3 encompasses emissions not produced by the company itself and are not the result of activities from assets owned or controlled by them but by those indirectly responsible up and down its value chain – for example, from the transportation of products.
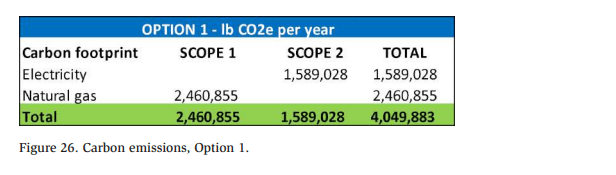
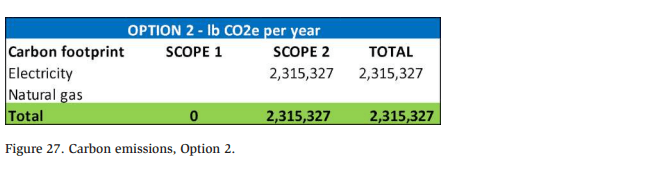
Option 2 eliminates the Scope 1 emissions, and the annual carbon emissions drop by around 43% compared with Option 1, representing a significant step toward decarbonization. Additionally, the Scope 2 emissions are reduced owing to the use of solar electricity. The main decarbonization targets are:
- Increase electrification = higher electricity kWh
- Reduce/eliminate fossil fuel
- Reduce water waste
Option 2 presents a reduction in water evaporation in the evaporative condenser, using the desuperheater and heat pump. By using recovered heat for the heat pump, the heat rejection in the evaporative condenser is reduced from 7,037 MBTUH (2,063 kW) to 3,449 MBTUH (1,026 kW), a 51% savings compared with Option 1.
The savings in water are estimated to be 1,845,690 gallons per year owing to the reduction in evaporation in the evaporative condenser. This is an estimated cost of $27,316 per year.
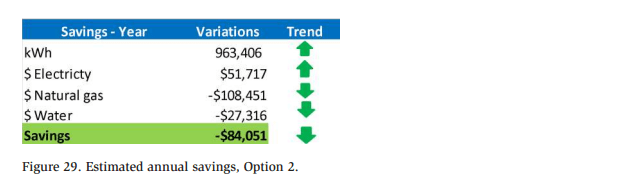
The increase in electricity costs is offset by natural gas elimination and water savings, as well as increased energy efficiency, which is due to the higher evaporation temperature:
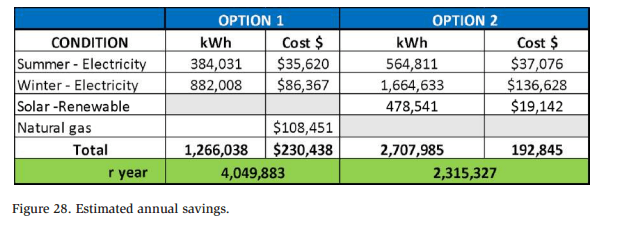
The annual savings for Option 2, compared with Option 1, is summarized as follows:
Replacing the natural gas boiler with an industrial electric boiler is another option for electrification. However, since we also seek energy efficiency, we can obtain a higher system COP by integrating the cooling and heating processes. Heat pumps require electricity but can produce around 3 or 4 kWh of heat for every kWh of power they consume. The most efficient boiler produces 0.98 kW of heat for every kWh of power. The replacement of oil and other lower-efficiency boilers leads to a further reduction in carbon emissions and additional cost savings.
A LCC analysis is essential to determine the most efficient system design. Several energy efficiency product offerings are available, but none of them are a one-size-fitsall solution.
Options 1 and 2 adopted a single-stage NH3 system. In Option 2, the system was designed with an evaporation temperature of 27°F (−3°C), higher than Option 1 with 23°F (−5°C). Furthermore, the falling film chiller can make ice water at 33°F (0.5°C).
A piston or screw compressor can be used, depending on the capacity and partial load requirements. The choice between one type or another varies depending on the product availability, the COP analysis considering full and partial load requirements, and personal choice. The piston compressor adjusts to partial loads by unloading several cylinders. The screw compressors reduce capacity using a slide valve. In both cases, the COP drops in partial load because of the isentropic efficiencies. Using a variable speed drive, the COP values of both compressors can be maximized by adjusting the compressor speed to the partial load requirements. In general, piston compressors can reduce speed to 500 RPM and screw compressors can reduce speed to 1,500 RPM. The quantity of compressors and the COP analysis in full and partial loads is a good indicator. The discharge temperature superheat for heat pumps is higher in a piston compressor. For this study, we consider screw compressors for the refrigeration systems. For the heat pump, we adopt piston compressors.
Option 1 is considered using two screw compressors with the partial load performance:
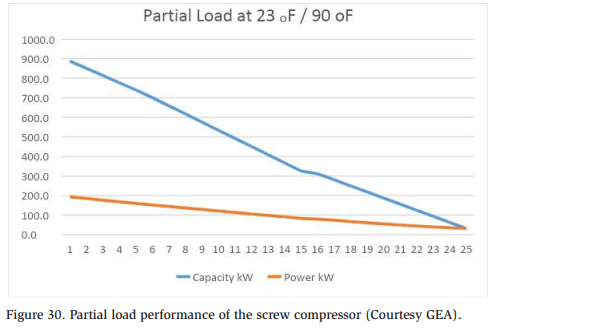
Option 2 is considered using two screw compressors with the following partial load performance.
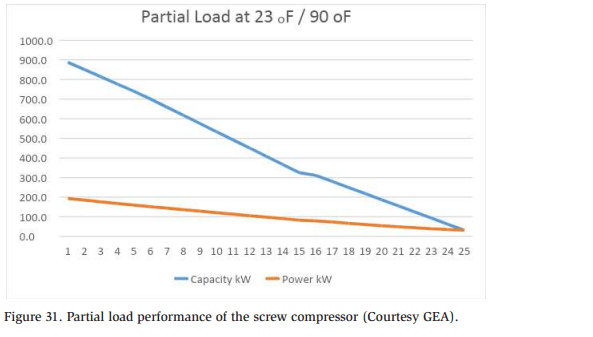
The COP partial load performance is similar for all screw compressors. The differences are related to compressor design, thermodynamic efficiencies, and design temperatures.
The heat pump uses a piston compressor and has the following partial load profile:
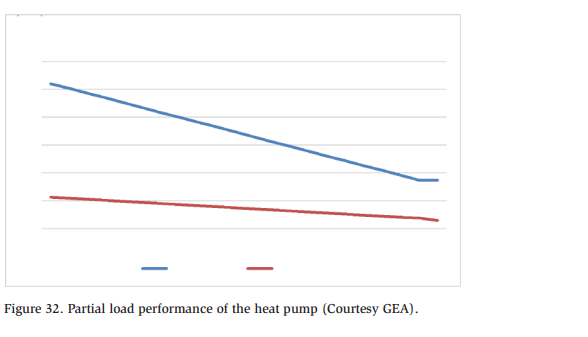
The heat pump with a piston compressor was selected to meet the hot water requirement of 194 °F (90 °C).
To create a business case for decarbonization, it is important to analyze not only the initial costs but also the system impact during the life cycle. This can be achieved by performing a life cycle cost (LCC) that indicates the total cost of ownership (TCO).
These analyses are outside the scope of this study but are crucial tools to create a strong business
A full TCO analysis must include a forecast of operational conditions that consider partial loads, the number of running hours, electric costs, service intervals, and parts required over 20 years.
The compressor energy consumption is one of the highest operational costs during a system life cycle. To analyze its influence more comprehensively, the LCC analysis can be a decision-making factor, helping to clarify the most effective solution. The same approach can be applied to the evaporative condenser. Notably, Option 2 uses a heat pump, using part of the rejected heat from the refrigeration system.
The in-depth load profile analysis helps clarify system behavior and opportunities.
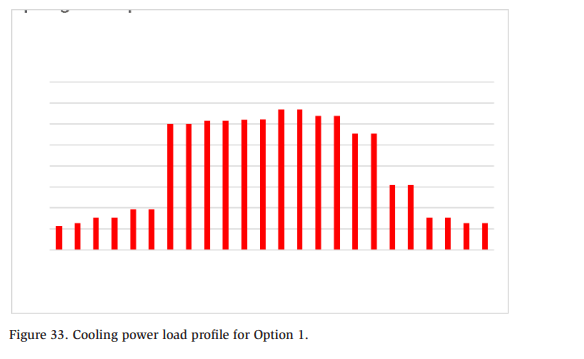
The load distribution during the day shows the peak loads occurring during the onpeak demand period. Herein, two approaches were considered to avoid the on-peak demand: ice storage and solar panels.
Although the plant experienced an increase in kWh owing to the ice maker power consumption, two direct benefits are observed. First, the ice maker enables cooling at a lower off-peak kWh, and most importantly, eliminates the risk of higher demand during on-peak hours.
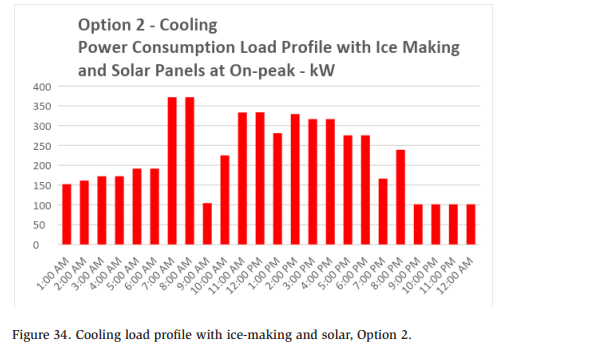
A critical factor is the improved load distribution during the day, considering that the ice maker is charging at 1:00 AM and discharging at 9:00 AM.
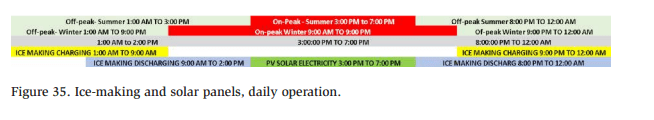
Based on the Florida forecast, the integrated solar system (capacity of 322 kW) can operate for ~124 hours each month.
Considerations of the Solar System
The increased use of renewable energy is crucial in the energy transition to Net Zero. According to The Global Renewables Outlook Edition 2020, prepared by the International Renewable Energy Agency, in the chapter A Widening Gap Between Rhetoric and Action:
“The gap between aspiration and the reality in tackling climate change remains as significant as ever, despite mounting evidence of the harm that climate change is causing. The negative effects of climate change are becoming more evident yearly (NASA, WMO, 2020). Yet global energy-related CO2 emissions, despite leveling off periodically, have risen by 1% per year on average over the last decade.”
The major conclusions from this report are outlined as follows:
- “The energy sector has started changing in promising ways, with the widespread adoption of related technologies boding well for a sustainable future. Solar PV is increasingly the cheapest source of electricity in many markets.
- Renewable power generation is now growing faster than overall power demand. 2019 was the first time when fossil-fuel-based generation declined while overall electricity generation increased.
- Yet renewables are growing too slowly in major energy-consuming sectors like buildings and industry. Deployment in these areas remains well below the levels needed to create a climate-safe energy system.
- The share of modern renewable energy in global final energy consumption has increased only slightly since 2010, staying around a threshold of about 10%.1 In simple terms, while renewables are increasing, so is energy demand.”
According to the FPL website (2018), “the installed cost of a mid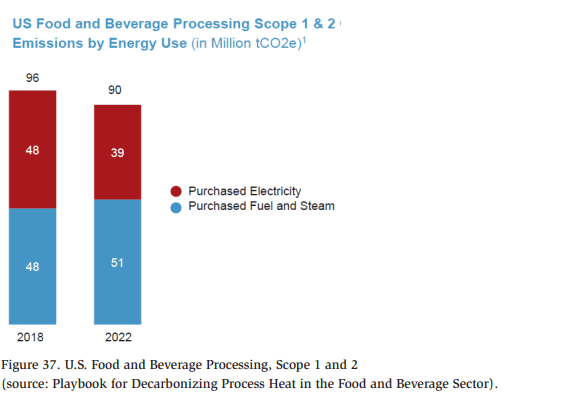 size commercial-scale solar array—including inverters and balance-of-system (BoS) hardware—was $1.83 per watt of output power. This cost translates to roughly $0.03 per kilowatt-hour forelectricity produced over a 30-year lifetime, which is competitive with many utilities’ business rates.”
The target plant requires a solar system with a minimum capacity of 1,753 kW to provide electricity during on-peak hours. A ballpark analysis using the information provided by Trina solar tracker provides the following estimation:
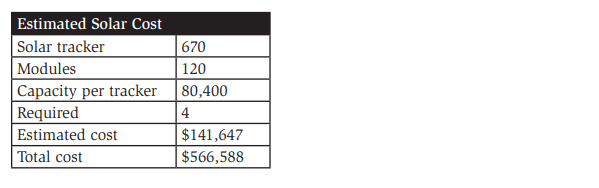
The cost calculation considers industrial customers’ updated benchmark for solar panels, namely $1.76/W, published by the Renewable Energy Agency.
Finally, it is essential to note that the 2022 Inflation Reduction Act provides additional tax credits for solar systems and other energy efficiency projects.
Building a Business Case for Sustainability
This graph shows that the food and beverage industry’s purchasing of fuel and steam is growing, which opposes the stated decarbonization goals.
The main challenges to overcoming this issue are the uncertainty in replacing wellknown solutions, like boilers, and the competitive price of natural gas and other fossil fuels.
Overall, it is necessary to build a strong business case for sustainability projects. The current payback and IRR NPVI analysis must be changed to accelerate the transition to Net Zero. Even with the government tax benefits, the initial costs to add solar panels, ice accumulation, and new technologies still create cost pressures that delay sustainability efforts The CAPEX cost-benefit analysis framework currently used by most companies may not be adequate to capture all the cost-benefits for the decarbonization projects because they do not have short-term payback.
If we envision a low-carbon economy by 2050, all analyses must consider the 25 years we have ahead. The CFO Leadership Network’s “CAPEX Essential Guide” recommends upgrading the traditional CAPEX to include a 21st century sustainabilityrelated analysis. The company must align its purpose, values, and vision with longterm strategic plans.
The Center for Sustainable Business from the New York University Stern School of Business proposes a framework named Return on Sustainability Investment (ROSITM). This proprietary methodology bridges the gap between sustainability strategies and financial performance. The goal is to build a stronger business case for all sustainability initiatives.
The current bottom line for the business case is profit, but the new business case for sustainability must include people, the planet, and profit while aligning with the company’s purpose fulfillment.
The company’s sustainability targets must be considered a non-financial asset. Other areas of opportunity include:
- Revenue growth
- Savings on operational expenses
- Lower cost of capital
- Risk avoidance
Risk avoidance may be one of the most critical justifiers for a sustainability initiative. The risk of not acting now may have a significant financial impact on the company and society in the future.
Conclusion
This study briefly overviews decarbonization opportunities in a small dairy plant.
The same approach can be applied to different industries, states, and electricity costs.
Savings on energy, water, and waste recovery are the easiest issues to consider and modify to improve decarbonization. Tax credit benefits represent an attempt to capture these savings in the economy.
Falling film chillers, heat pumps, ice accumulation, and PV solar panels can drastically reduce the Scope 1 and 2 carbon emissions in a dairy plant, as demonstrated in this study.
The food and beverage industry, and other sectors, has the potential to make a significant transition from a carbon-intensive industry to a low-carbon industry.
However, to accelerate decarbonization efforts, the industry must change the shortterm payback analysis to align with a purpose and vision for a long-term low-carbon society in 2050.
References
- United States Department of Agriculture. Milk production. March 2023.
- Sustainability Study Guide. International Society of Sustainability Professionals.
- Guide for Sustainable Refrigerated Facilities and Refrigeration Systems. ASHRAE.
- U.S. Green Building Council: Chapter 8. Energy & Atmosphere Guideline.
- 2022 ASHRAE handbook – Refrigeration (IP).
- Unsworth R, Hoffman K. Ammonia Heat Pumps Helping to De-Carbonize Food and Beverage Industries. Institute of Refrigeration, 2022.
- Unsworth R, Vermeer H, Gerritsen J. Add On Heat Pump for Dairy Application. IIR.
- U.S. Energy Information Administration. CO2 Emissions.
- Playbook for Decarbonizing Process Heat in the Food and Beverage Sector – Heat Pumps and Electric Boilers as Enabling Technologies. Guidehouse Inc. June 2023.
- Zuberi MJ, Hasanbeigi A, Morrow WR. Electrification of U.S. Manufacturing with Industrial Heat Pumps. Lawrence Berkeley National Laboratory. October 2022.