


Operating Cost Comparison between Transcritical CO2 and Ammonia Recirculation Systems in a Cold Storage Warehouse
Chris Herzog, Principal Industrial Refrigeration Equipment Partners and Peter Lepschat, Director of Engineering Henningsen Cold Storage
INTRODUCTION
Henningsen Cold Storage Co. (HCS) is a public refrigerated warehousing company based primarily in the Pacific Northwest. In business since 1923, HCS operates more than 60 million ft3 of multi-temperature-controlled storage at 13 facilities. The company embraces a continuous improvement culture and has applied it countless times in designing new facilities and optimizing existing facilities.
For example, in terms of energy efficiency, continuous improvement efforts have driven specific electricity consumption at HCS facilities down to a fraction of industry averages. The International Association of Refrigerated Warehouses (IARW) periodically surveys its members, with one area of inquiry being energy consumption. Based on the data it collects, the IARW calculates an average specific energy consumption metric, expressed as annual kWh/ft3 . In a 2015 IARW survey, the industry average was 1.12 kWh/ ft3 of refrigerated space. As a point of comparison, the HCS corporate average in FY 2017/2018 was 0.482 kWh/ ft3 . HCS’s two most recently constructed ammonia refrigerated facilities operate at or below 0.3 kWh/ft3 . Table 1 illustrates HCS’s specific energy consumption by facility over the past two fiscal years.
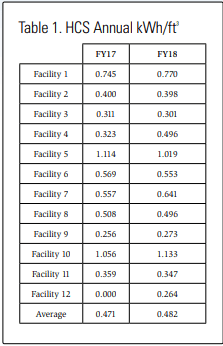
The newest Henningsen facility was installed in Grandview, WA, a roughly 100,000 ft² freezer designed to house approximately 20,000 pallets at -5°F and an 11,000 ft² of +40°F refrigerated dock space. This facility opened for business on June 28, 2018, to serve local fruit processors. It is not included in Table 1 due to a lack of meaningful energy data.
DECISION-MAKING PROCESS
Early in the process of planning its most recent facility, HCS decided to investigate alternative refrigerants/refrigeration systems to anhydrous ammonia. Past initiatives had focused on reducing the quantity of ammonia refrigerant in the system and had achieved much success in lowering charges while maintaining industry-leading levels of energy efficiency. The next logical step was to see if reducing or even eliminating ammonia from a system and still operating in an efficient manner as compared with the best ammonia systems was possible.
The following steps outline the process used to determine the viability of alternate technologies:
- State the goal: Reduce our ammonia charge to below its threshold planning quantity (TPQ) of 500 lb or eliminate it altogether.
- Identify options to explore:
- Packaged NH3,
- Packaged or split systems using synthetic refrigerants,
- CO2/NH3 cascade systems,
- Transcritical CO2 system, and
- Central ammonia system with reduced refrigerant charge.
- Generate a list of categories to compare:
- First costs, including facility-related construction cost impacts;
- Energy efficiency and other utility costs;
- Operation and maintenance (O&M) costs;
- Short- and long-term reliability;
- Effects on construction schedule;
- Regulatory compliance costs;
- Assemble a list of specific questions or comparisons for each category. Appendix 1 is an example of an outline illustrating the categories and specific questions. Note that this is not an exhaustive list; many other factors arose and were also included in discussions held during the process of evaluation.
- Obtain answers to each question for each system type, sourced via the following:
- Industry experts;
- Experienced end users;
- Independent engineering firms;
- Technical publications, such as white papers, textbooks, manufacturers’ technical data, and trade publications;
- Trade associations, including peer networking, industry trade shows/ expositions, and technical presentations and papers; and
- System manufacturers.
- Perform a comparative analysis on the collected questions and answers.
Consider:- Advantages of each option for each question,
- Disadvantages of each option for each question, and
- “Deal killers” that would instantly eliminate an option.
- Assign weighting for each question to help drive a final decision.
Some of the identified refrigeration system types proved to be relatively easy to dismiss early in the process for various reasons. For instance, with the uncertain regulatory future of hydrofluorocarbons HFCs and other synthetic refrigerants and the known energy penalties associated with these types of systems as compared with proven options using natural refrigerants, the conventional HFCcharged split and packaged systems were not considered viable alternatives even after considering their reduced first costs and regulatory burdens. Relatively high energy costs, the high and escalating cost of HFC refrigerants, and a potential lack of suitable replacement refrigerants after projected refrigerant phase-out dates contributed to the decision to eliminate them from contention.
Likewise, the CO2 /NH3 cascade system was dismissed early on, but for different reasons: It provided little to no reduction in regulatory burden, minimal improvement in operator safety, greater complexity, higher energy consumption than existing NH3 systems, a higher first cost, and higher O&M costs.
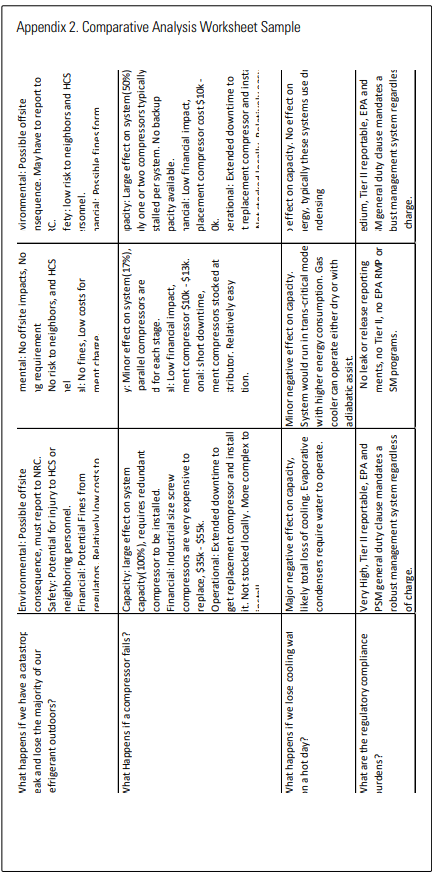
Removing these options from the analysis left three options to compare: packaged ammonia, CO2 transcritical, and low-charge conventional ammonia. The three remaining system options were inserted into a matrix, and each question was answered for each type of system. Clearly, this document became very large, and thus has not been included in its entirety in this paper. Instead, an abbreviated document illustrating sample questions as applied to each type of system can be found in Appendix 2.
COST ANALYSIS
The results of initial analysis done by HCS indicated that the most promising system types were the “traditional” central ammonia plant (with special design features to improve efficiency and reduce charge) and the transcritical CO2 system. The ammonia system features were well known to HCS, and its costs could be reasonably well assumed from some of its existing facilities. But the new transcritical CO2 system was somewhat of a wild card. Being a newer and less understood technology, determining the operating costs with high accuracy was important to make the best decision.
POWER CONSUMPTION
To assemble the most accurate data possible, particularly in the area of energy use, a company specializing in energy use in refrigerated facilities was engaged to predict the annual power consumption of the CO2 system and the ammonia system, given the construction, system type, climate, and expected use of the facility.
This company also analyzed a third system type: a conventional packaged freon system with multiple roof-mounted air-cooled condensing units coupled with direct expansion electric defrost evaporators. This system was included because it has the lowest first cost, and the ability to compare energy savings and cost differential between this and the other system types was desirable. The information resulting from this comparison was used when negotiating with local energy providers for available financial incentives or rebates (Table 2).
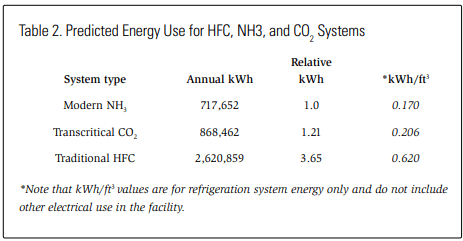
Appendix 3 provides the energy analysis in its entirety. The first key finding is that the transcritical CO2 system uses more energy than the NH3 system, but not that much more. Remember too that the comparison NH3 system has a specific energy use that is 75% lower than the industry average. In reality, when compared with an industry standard, the transcritical system is projected to use around 50% less specific energy.
The analyzed ammonia system included numerous energy-saving measures that have been successfully incorporated into other modern HCS systems: floating suction and head pressure controls, predictive hot gas defrost with float drainers, variable- frequency drive VFDs on all fan motors, VFD for at least one screw compressor, glycol oil cooling with heat recovery, and dock dehumidification. The transcritical CO2 system also included many energy-efficiency measures (EEMs); they are part of the full energy analysis and also described in the CO2 System Details section later in this paper. The HFC system was intended to be a baseline for comparison only, so it was analyzed in its simplest form, with no EEMs.
Although the predicted energy use is lowest for the NH3 system, the CO2 system is close enough to warrant further investigation. After all, while energy use is the second largest operating cost in a facility of this type, it is certainly not the only cost.
WATER USAGE
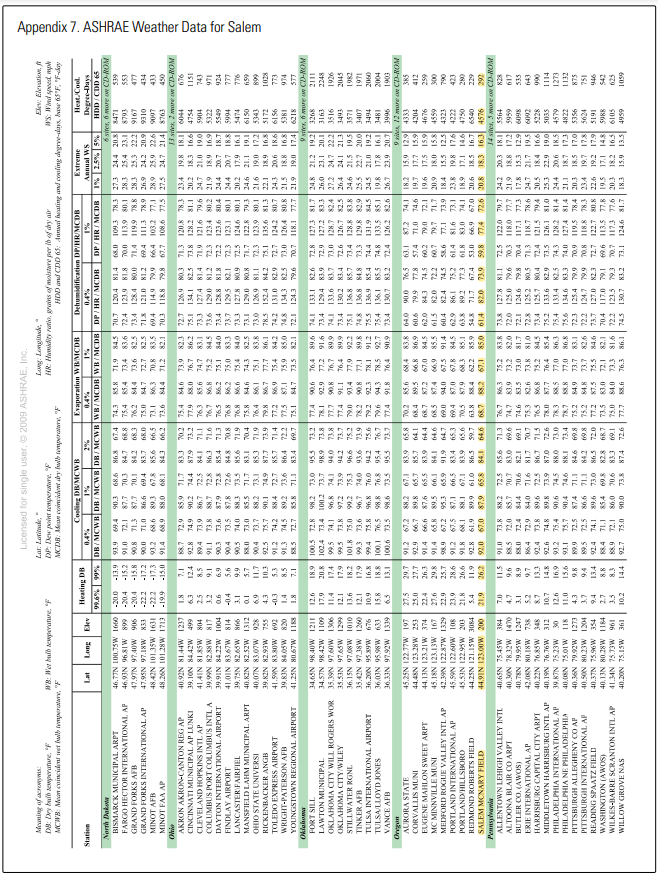
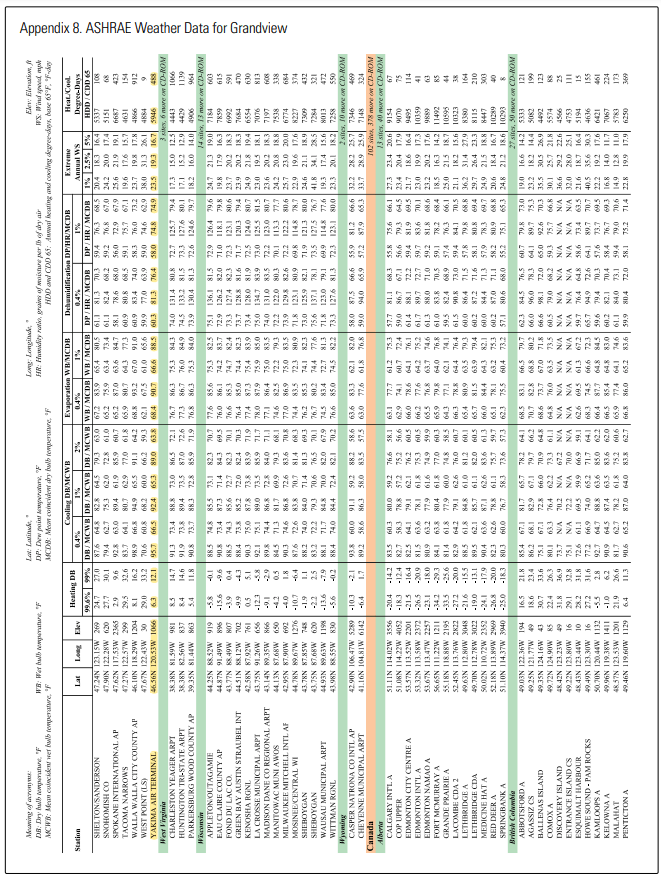
One area in which the CO2 system may be superior to a conventional NH3 system is water usage. Although this is frequently overlooked, the cost of water to operate an evaporative ammonia condenser is significant. A transcritical CO2 system typically uses an air-cooled gas cooler/condenser, which uses no water at all. This, however, is not very good from an energy use perspective. In the Grandview facility’s climate, the most cost-effective application was found to be an adiabatically assisted gas cooler. This heat exchanger uses material similar to the pads found in cooling towers. The pads are wetted with spray or drip headers, and air entering the dry gas cooler must first pass through these pads. The resulting air is precooled to nearly wet bulb temperature, which can greatly increase gas cooler efficiency. The new HCS facility was to be located in an area with a relatively dry climate (design wet bulb temperature of about 70°F or 21°C), even though temperatures frequently exceed 100°F (38°C) in the summer. The adiabatically assisted gas cooler is expected to keep the saturated discharge temperature below the critical point of CO2 (88°F/31°C) even when the ambient temperatures are much higher. Because CO2 system efficiency suffers greatly when the critical point is exceeded, employing an adiabatically assisted gas cooler
was found to be worthwhile, despite the extra cost of water. Fortunately, this type of heat exchanger uses less water than an evaporative condenser, as seen in Table 3.
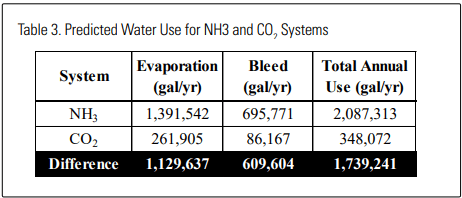
Depending on the cost of water and water treatment, this can be a significant cost advantage for the CO2 system. For this project, the predicted annual savings included approximately $20,000 for water, sewage, and maintenance. This value may be even higher if the assessment assigns a value to “environmental responsibility” based on not wasting millions of gallons of water every year.
BUILDING CONSCTRUCTION
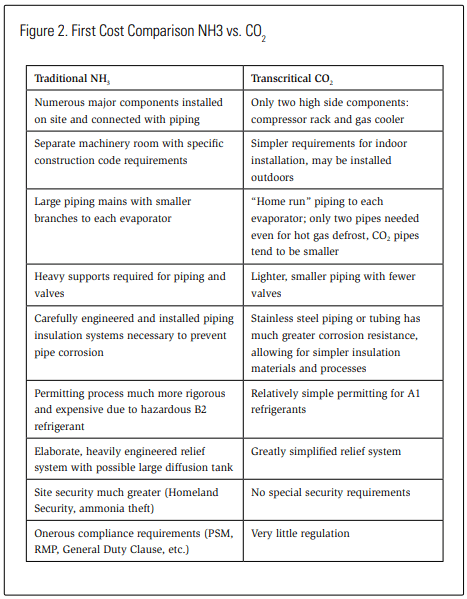
Building a cold storage is expensive, and the cost of code-compliant ammonia refrigeration room is a significant part of that expence.Per the International Fire Code (2015) and IIAR 2 (2014), ammonia refrigeration rooms must be fire rated (or sprinklered) and contain safety systems with ammonia detection, alarms, and ventilation fans. Equipment must be anchored to engineered structural slabs, and large, heavy piping must be supported.
By contrast, a transcritical CO2 system uses a factory-built high side (compressor rack) that is relatively compact compared with NH3 equipment and can be located outside. Piping tends to be smaller and lighter (frequently it is stainless tubing instead of S40 or S80 pipe). There are no large valve groups to support, as nearly all control valves are located on the compressor rack. Significant structure is still required to support the compressor rack and gas cooler (condenser). But the compressor rack may be sited outdoors, on the roof, or in a smaller, simpler machinery room space. Construction quotes were requested for the new facility with both conventional recirculated NH3 and transcritical CO2 refrigeration systems. Including all costs except the refrigeration system, construction pricing came in about $300,000 less for the CO2 option.
REFRIGERATION SYSTEM
Another area that favors CO2 over traditional NH3 is the cost for the refrigeration system itself. The construction process is quite different, as Table 4 illustrates.
Given these differences, the total refrigeration system cost was quoted about $534,000 less for CO2 than for NH3. Another important factor to consider is that the CO2 facility had an estimated construction time 5-6 weeks less than the same facility with an NH3 system.
OTHER COST DIFFERENCES
Along with these major cost items, some other costs may favor the CO2 system. These include
- Insurance,
- Decreased compliance staff,
- In-house refrigeration system maintenance,
- Code compliance costs, and
- Employee safety trainings.
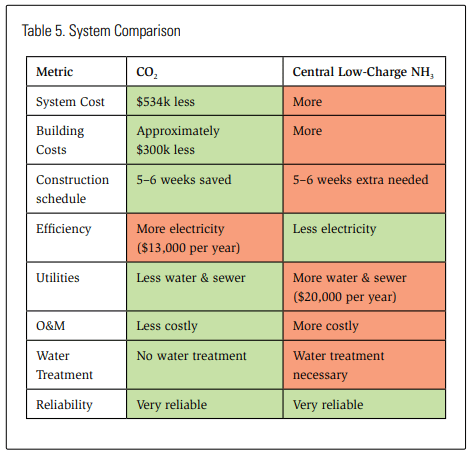
When the numbers were evaluated, the CO2 transcritical system was a convincing, and surprising, winner (Table 5). Despite a higher predicted energy usage, it offered big cost savings for initial construction and the potential to offset higher energy usage with reduced water usage, plus some other lower operating costs. Ultimately, HCS decided to build the CO2 system.
CO2 SYSTEM DETAILS
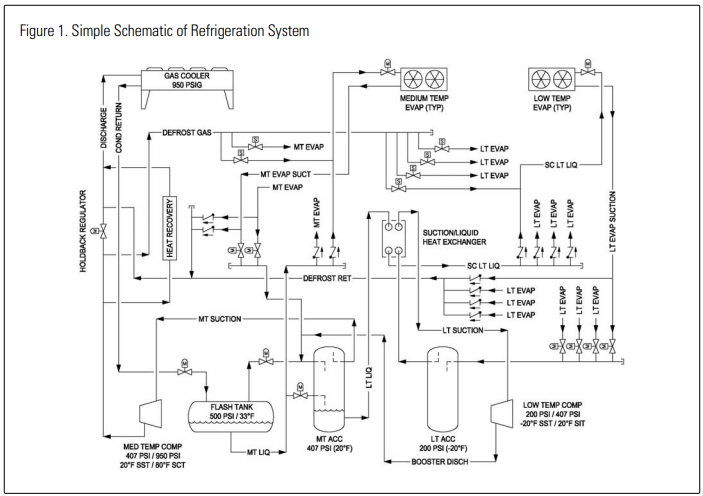
This paper does not intend to explain how transcritical CO2 refrigeration works or offer instruction to designers. Numerous references are available on those topics. Rather, this paper aims to examine the design and operation of a particular system to compare the similarities and differences between it and ammonia refrigeration. Figure 1 shows a simplified schematic for this system.
Transcritical CO2 high sides resemble grocery store and other commercial compressor racks. This is partly because these systems were the first to be used in commercial applications and partly because they are built with a currently limited selection of semi-hermetic compressors. This rack includes several units of two models, a 30 hp (22 kW) machine and a 50 hp (37 kW) machine. All the pressure vessels, heat exchangers, and control valves are also on the rack—with one exception. The motorized expansion valves are mounted directly on the evaporators. The gas cooler is mounted outdoors like a conventional condenser, and the evaporators are ceiling hung inside the warehouse.
The system described here is a twostage refrigeration circuit starting with the booster compressors, which operate at around 212 psig suction (14.6 barg) and discharge into the intermediate pressure accumulator/intercooler (MT ACC) at 441 psig (30.4 barg). This vessel cools the booster discharge gas and is also the suction accumulator for the dock evaporators. Vapor from this vessel is drawn into the medium temp (high stage) compressors, which discharge at around 950 psig (65 barg) typically, but can get as low as 50°F/638 psig (10°C/44 barg), depending on ambient conditions. A holdback valve in the main discharge line serves to create a pressure differential for the heat recovery devices and hot gas defrost system to function.
High-pressure (and possibly transcritical) gas enters the gas cooler, and cooled gas drains to the flash tank through a regulating valve. This vessel is akin to a controlled pressure receiver (CPR) in an ammonia system; it is maintained at about 500 psig (34.5 barg) through another regulating valve connected to the MT ACC vessel.
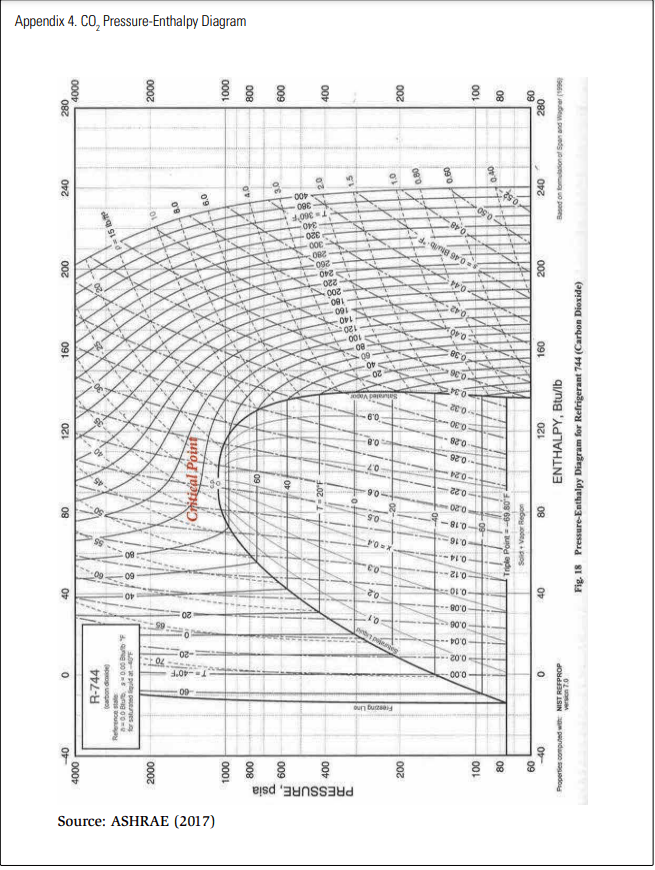
The regulating valve on the inlet of the flash tank is the key to making the system work even when the condensing temperature exceeds 88°F/31°C (1,071 psig/73.9 barg). When CO2 exceeds these pressures on the high side, it cannot be condensed to liquid (see “Critical Point” on CO2 pressure/enthalpy diagram in Appendix 4). When a transcritical fluid passes through the regulating valve, its pressure drops to 500 psig (34.5 barg). At that point, a portion of it turns to liquid, and the remainder becomes vapor. The vapor is drawn into the MT ACC vessel. Although perfectly functional, this is not a desirable situation; during transcritical operation, the medium- temperature compressors are actually handling a portion of the condensing load. This situation reduces system operating efficiency.
Liquid in the flash tank is used to feed the medium-temperature (dock) evaporators and the MT ACC vessel to cool the discharge gas from the lowtemperature (booster) compressors. Suction from the dock evaporators returns to the MT ACC vessel. Like the freezer evaporators, the dock evaporators are DX with hot gas defrost. Dock evaporators also include a hot gas reheat coil for extra dehumidification.
Liquid from the MT ACC is used to feed the freezer evaporators. It is first piped through a liquid/suction heat exchanger against freezer evaporator suction, which provides a margin of subcooling and helps prevent flash gas in the liquid line. The freezer evaporator suctions are piped to the low-temperature accumulator (LT ACC). Dry suction from this vessel passes through the liquid/suction heat exchanger before reaching the low-temperature compressors, which completes the cycle.
All evaporator defrosts are by hot gas. Unlike ammonia hot gas defrost, the heat used to warm the coils and melt ice is mainly sensible, not latent. A very high sensible heat is one of the more useful qualities of CO2 . In this case, hot gas from the high- pressure side of the holdback valve is introduced via solenoid into the evaporator liquid line (remember that each evaporator has its own liquid and suction lines all the way back to the compressor rack). Normal liquid flow is stopped, as the defrost pressure is much higher than liquid pressure, but defrost gas is prevented from back feeding the liquid lines by check valves. On the return side, a motorized solenoid is closed in the evaporator suction line, and instead the defrost return is pushed into the main discharge line, downstream of the holdback valve. These defrost return lines also have check valves to prevent discharge gas from back feeding the suction lines.
FIRST COST COMPARISON
The initial cost comparison offers an opportunity to examine the preliminary projections. The Grandview facility was completed in spring of 2018, and the refrigeration commissioning began in May. By June 28, the facility was open for business and receiving frozen product.
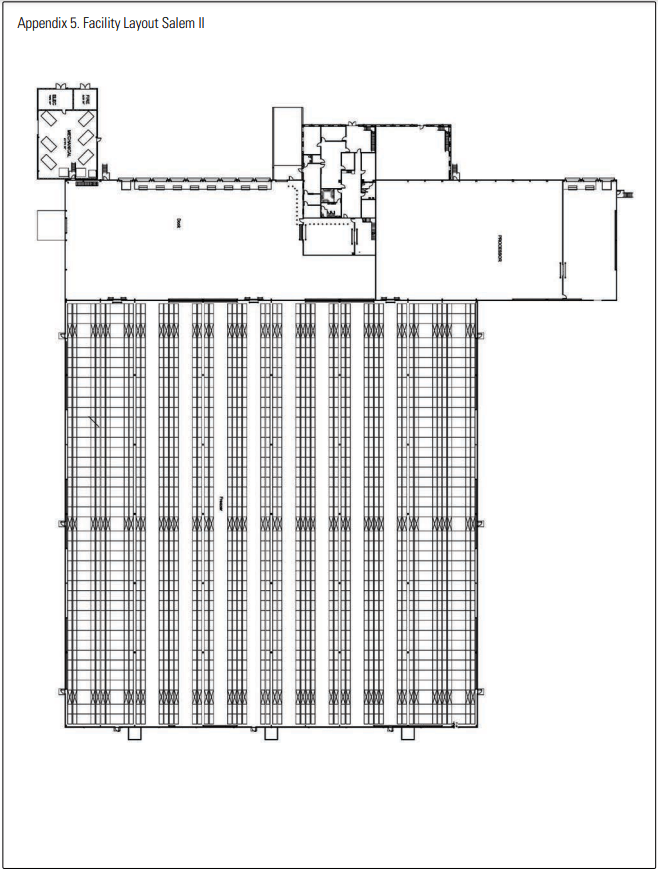
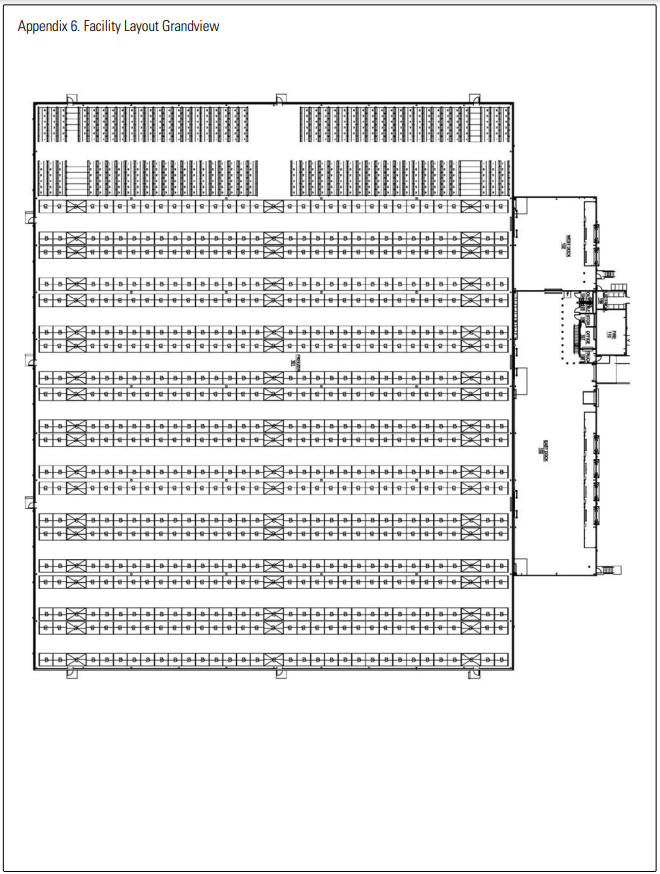
To give a sense of relative construction, the new Grandview facility is compared with a different facility built by HCS in Salem, OR, in 2017, and referred to as “Salem II.” The facilities are similar in footprint, operation, and construction methods, and both were built by the same team of contractors. Salem II has about 20% more refrigerated space, so pricing has been scaled to account for this. Appendixes 5 and 6 show layouts of each facility for reference, and Figure 2 shows the relative values.
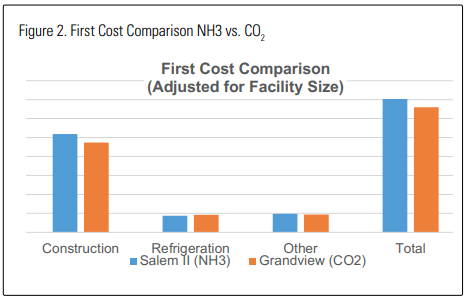
The overall project cost came in about 6% less than Salem II built a year earlier. This is after adjusting for the difference in size between the two facilities. The overall cost savings were close to the predicted value, although the refrigeration system actually cost more than expected. This may be due to the contractor’s “learning curve” during first exposure to new technology and construction methods. The actual difference in finished project cost is enough to buy about 15 years worth of electricity for the CO2 refrigeration system, at current rates.
OPERATING COST COMPARISON
So how do the overall true operating costs for this facility compare with a similar facility that has a more conventional recirculated ammonia refrigeration system?
At the time of writing, the facility had been fully operational for a little more than six months. Those six months include most of a summer, all of fall, and the first half of winter. It’s too early to make any absolute statements, but some data are already available.
Starting with energy usage, the preliminary model predicted about 20% more energy use for the CO2 system on an annual basis. This figure was calculated by taking available energy use data and extrapolating it over a year’s time.
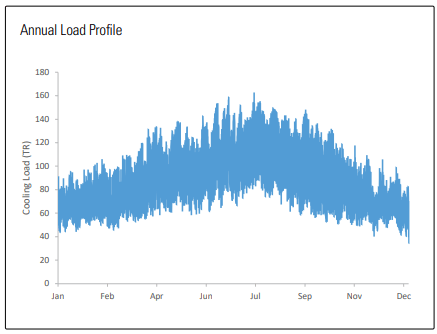
Figure 3 suggests that assuming springtime refrigeration load closely approximates autumn load would be reasonable, and because energy use data for autumn are available this assumption was incorporated into an annual estimate. Figure 3 also shows that the smallest load occurs in January. January 2019 data are not yet available for this model, so the December data are used, which should provide a conservative prediction.
Pointing out some of the design features used on this system to minimize energy usage and help CO2 compete with NH3 on a large industrial system is useful. The energy consultant on this project analyzed several different design improvements and predicted the energy savings and payback for each one. Each design improvement is known as an EEM. All EEMs qualified for some degree of funding from the utility provider. Among the EEMs chosen for this project are
- Refrigeration system heat recovery for underfloor heating: eliminates cost of external heating and takes load off the gas cooler.
- Dock dehumidification: Adding hot gas reheat coils on the dock evaporators to maintain low humidity levels in the refrigerated dock reduces the latent load in the freezer and allows for less frequent defrost cycles.
- Efficient freezer evaporators: This measure increases the evaporator coil size, improving capacity without increasing connected fan motor power.
- Optimal evaporator fan control: Selecting electronically commutated, or EC, motors provides a more efficient operation than AC motors. These motors also vary speed to maintain zone temperature setpoints. Fan motor power varies with the cube of speed, thus significant energy savings are realized whenever the evaporators are under part-load conditions. Evaporator fan motors vary speed from 36% to 90% of maximum motor RPM.
- Hot gas defrost for evaporators: Utilizing hot gas for evaporator defrost instead of electric resistance heat offers significant energy savings. Though not often seen with transcritical systems, as it requires evaporators rated for very high pressures, it is very effective and an efficient use of the high sensible heat available in CO2 discharge lines.
- Gas cooler optimization: Selecting a gas cooler with additional heat transfer surface area allows for more efficient heat rejection. An adiabatic upgrade cools the incoming air during hotter weather to allow for lower condensing (or gas) temperatures, reducing compressor lift. EC motors are also recommended for improved efficiency and variable speed capability. Gas cooler fans vary speed from 10% to maximum motor rated RPM. A floating head pressure strategy is also included for optimum gas cooler performance.
- Fire riser room heating: This measure comprises the installation of uninsulated copper glycol manifolds in each of the riser rooms, for protection against freezing. This eliminates the need for electric unit heaters.
- Glycol pump VFD: Using a pump VFD to vary flow in the glycol loop based on under-floor temperature setpoints saves pump energy whenever temperatures are satisfied.
- High-speed freezer doors: Installing insulated, bi-parting freezer doors that rapidly open and close further reduce sensible and latent loads in the freezer. Door openings are triggered with motion sensors.
These items are nearly the same as at the Salem II facility, where they are applied to a conventional recirculated ammonia system. Based on the values at Grandview for January through May, which are predicted using Figure 3, Figure 4 compares energy use between the two systems.
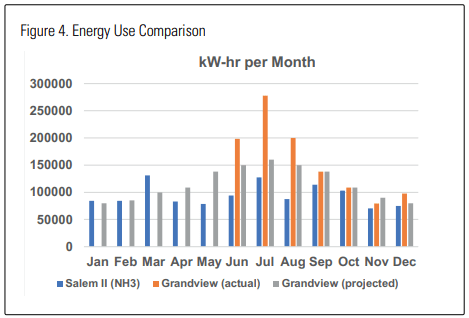
One finding that immediately stands out is how much energy the CO2 system used in June, July, and August. These were expected to be the worst months, but actual use far exceeded the predicted value. This anomaly was investigated in late summer and was attributed to several EEMs that were not properly implemented, including
- Evaporator fan speeds were fixed and not modulating;
- Gas cooler fan speeds were fixed, and floating head pressure was not enabled;
- Freezer evaporations were being defrosted every 8 hours, instead of every 48 hours as recommended (this long interval possible due to dock dehumidification);
- Low-temperature suction setpoint at -25°F (-32°C) instead of the recommended -17°F (-27°C);
- Intermediate temperature suction setpoint at +19°F (-7°C) instead of +25°F (-4°C); and
- Underfloor glycol pump VFD not enabled
Once these items were addressed, energy use began to more closely resemble predicted values. The CO2 system energy use has been very close to that of the NH3 system since the “recommissioning.” It remains to be seen what the effect will be during the warm weather months.
Bear in mind that the energy figures reflect use for the entire facility, because the refrigeration system power is not metered separately. The current “best projection” is that the CO2 system will use about 22% more energy than the NH3 system— approximately the predicted 20% value.
The seemingly inconsistent values for Salem II energy usage are attributed to the period of data collection (not always the same number of days for the month) and the possibility that some months may be “averaged,” rather than true measurements.
A key advantage of the CO2 system in this comparison is its decreased water use. Even with an adiabatic gas cooler, it uses much less water than a conventional NH3 system with evaporative condenser. There is also no need for chemical treatment. Figure 5 shows water use for the two facilities.
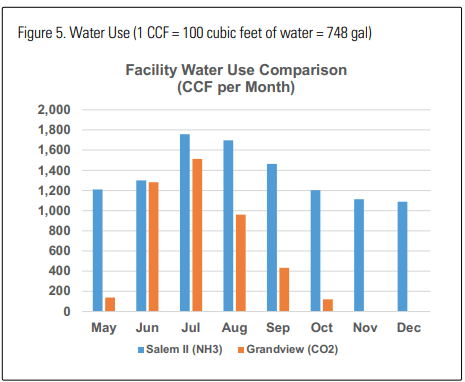
Water use was negligible in May because the system was being started and there was very little load. June and July are higher than expected, but still less than the NH3 system (values have been scaled for the relative sizes of the facilities). After recommissioning in late August, actual water use aligned with predicted values.
When weather turned cooler in late fall, water use went to essentially zero as the gas cooler stayed in dry operation at all times.
Energy and water use are very important performance metrics for cold storage, but they are not the only factors. Examining the two systems under discussion provides an opportunity to compare the two facilities’ operating costs and investigate the actual cost of ownership in a CO2 refrigeration system versus a conventional NH3 system.
Because Salem II is a larger facility, costs have been scaled proportionately, with ft3 of refrigerated space. Energy use was scaled similarly to provide a fair comparison, and costs unrelated to refrigeration have been ignored. With those factors taken into consideration, and using a random divisor on the true cost to protect sensitive financial information, an operating cost comparison can be developed (Figure 6).
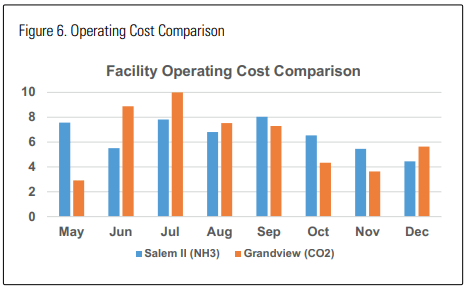
The May data from the Salem II facility are an aberration; this is when startup and pulldown began for the Grandview facility. By the end of June, Grandview was fully operational, and the data begin to have meaning. For June and July, Grandview operating costs are higher than those of Salem II. Remember, however, that the Grandview system had not yet been correctly commissioned for maximum efficiency; this was not done until nearly the end of August. The impact of this is immediately seen. Starting in October, the Grandview facility is operating at lower cost than Salem II. This trend reverses slightly in December, due to quarterly refrigeration maintenance by an outside vendor.
The most significant point in this analysis is that for the seven months with meaningful data, the CO2 facility has an overall operating cost just slightly higher (about 6%) than the ammonia facility. This analysis counts only costs that the refrigeration system affects, and it is normalized to account for the size differences between facilities. Power costs about 8.5% more in Salem than Grandview, but water and related costs are about 60% higher in Grandview than Salem.
Note also that the preliminary data suggesting a 6% higher cost for the facility with a CO2 system is based on the first seven months of operation. These include the three hottest months of the year, and for nearly that entire time the CO2 system operated sub-optimally.
With that issue corrected, and cooler months ahead (January through May), the CO2 system at Grandview is expected to result in about 5-10% lower annual cost than a comparable, highly efficient ammonia system.
CONCLUSIONS
With less than a full year of operation at Grandview, reaching any conclusions with 100% certainty is difficult. However, based on currently available data, the key points are there:
- Depending on climate, for a CO2 system to have a lower operating cost than a conventional NH3 system is entirely feasible. The key to determining this is probably humidity, or the wet bulb design temperature. The facilities compared in this paper are in climates with similar wet bulb design temperatures (around 68–69°F or 20°C). A transcritical system with a generously sized adiabatic gas cooler will be able to condense below the critical point at nearly all times.
- The CO2 system will use more energy in the summer months, but about the same as the NH3 system in colder months.
- The key to CO2 system efficiency is proper commissioning, which can potentially reduce energy consumption by 50% or more. Operator and technician training is therefore vital.
- The CO2 system will use much less water than the NH3 system (although, to be fair, fitting an NH3 system with an adiabatic condenser similar to the CO2 system gas cooler is possible).
- A facility with a CO2 system can be built significantly faster than the same size facility with NH3 system(5-6 weeks in this case)
- The permitting process is usually easier for a CO2 system as compared with an NH3 system
- To compete with a modern, efficient NH3 system, a CO2 system must have an adiabatic gas cooler, variable speed motors for all fans, and hot gas defrost.
- A CO2 compressor rack may be placed outdoors if needed, making CO2 an option for facility expansion where existing machinery room is maxed out or inconveniently located for future expansion.
- Return on investment can be increased with increased heat recovery efforts.
- A leak in a CO2 refrigerated warehouse will not necessarily damage product. This may be a competitive advantage because cold storage customers will have a reduced risk of spoiled product and will presumably have better insurance rates than for product going into an ammonia refrigerated warehouse.
For groups considering construction of a new refrigerated warehouse or expansion of an existing facility, CO2 should be a consideration among the natural refrigeration options. Depending on climate, CO2 may prove to be equal or superior to ammonia in terms of safety, water use, and overall operating cost.
REFERENCES
International Code Council. International Fire Code. ICC, 2018: Washington, D.C. International Institute for Ammonia Refrigeration. ANSI IIAR 2 “Standard for Safe
Design of Closed-Circuit Ammonia Refrigeration Systems.” IIAR, 2014: Alexandria, VA.
Owen MS, ed. “2017 ASHRAE Handbook-Fundamentals.” ASHRAE, 2017: Atlanta, GA.
Washington State Building Code Council. Washington State Energy Code (WSEC 2015). WSBBC, 2015: Olympia, WA.
APPENDIX 1. COMPARATIVE ANALYSIS ITEMS
CO2 Transcritical vs. NH3 Packaged and Centralized Refrigeration Systems
- First costs;
- CO2 vs. NH3 system direct cost comparison,
- . Deletion of engine room construction savings,
- Addition of enclosure for compressor rack,
- Addition of structural support for compressor rack,
- Elimination of rooftop support pipe rack,
- Addition of interior piping supports,
- Elimination of PRV system,
- Elimination of machine room ventilation system, and
- System scalability for future loads or building additions.
- Energy and utilities
- Annual kWh consumption comparison;
- Annual demand cost comparison;
- Annual water use comparison;
- Water treatment cost comparison; and
- Reclaim heat availability, quantity, and quality:
- Use within facility, underfloor heat, dock dehumidification, other; and
- Suitability for sale, as a revenue source.
- Operations and maintenance
- Compressor replacement cost versus overhaul costs,
- . Refrigerant cost comparison,
- Spare parts inventory and availability considerations,
- Worker hours per year for PM activities,
- Worker hours per year for predictive maintenance activities,
- Worker hours per year for repairs, and
- Leak point (valves, gaskets, flanges, shaft seals) count comparison.
- Reliability
- Compressor lifespan,
- . Effect of compressor failure,
- Effect of loss of refrigerant,
- Effect of control system failure,
- Effect of fan drive failure, and
- Effect of loss of water
- Schedule
- Speed of construction and
- Task integration with other construction activities.
- Regulatory
- Cost of Occupational Safety and Health Administration PSM compliance;
- Cost of United States Environmental Protection Agency RMP compliance;
- Costs of a major release:
- Onsite, people;
- Onsite, product;
- Offsite, people; and
- Offsite, environmental;
- Department of Homeland Security chemical security considerations; and
- Tier II reporting considerations
APPENDIX 3. HCS PRELIMINARY ENERGY ANALYSIS AND COMPARISON BY ENERGY 350
Owner: Henningsen Cold Storage
Facility: Cold Storage
Location: Grandview, WA
Subject: Projected energy use for NH3 vs. CO2 and estimated incentives from electric utility for high-efficiency operation
Background: Henningsen Cold Storage (HCS) recently constructed a new cold storage facility in Grandview, WA, to house approximately 20,000 American pallet positions. The facility consists of 99,000 ft² of 5°F freezer space and 11,000 ft² of +40°F refrigerated dock space. The site is staffed for one or more shifts per day, but the refrigeration system operates around the clock for a total of 8,760 hours per year.
A detailed energy study, funded by the electric utility, was conducted for the facility to analyze and quantify energy savings associated with upgrades to a www.iiar.org A Publication of the International Institute of Ammonia Refrigeration | August 2019 | CONDENSER | 57 transcritical CO2 . Washington State Energy Code (WSEC 2015) was used a guideline for the energy analysis; though it does not apply to transcritical CO2 refrigeration systems.
Methodology: As a refrigerated storage facility, loads are highly weather dependent, with peak loads occurring in the summer months. Concurrently, the facility is also used for seasonal pulldown loads of fruit, namely blueberries. Because this was a new construction project, data logging was not possible for the energy study. Rather the annual cooling load was determined from heat transfer calculations based on the building envelope construction, equipment specifications, and discussions with HCS.
A custom, MS Excel-based 8,760 energy model using typical meteorological year data for nearby Yakima, WA, was developed (from the U.S. Department of Energy’s National Renewable Energy Laboratory’s TMY3 dataset) to calculate energy use for the baseline case and each efficiency measure. Where applicable, this included the following:
- Conduction through the building envelope;
- Solar load on the roof;
- Infiltration loads;
- Internal heat gains;
- Underfloor heating energy;
- Pump energy for underfloor heating;
- Riser room heating loads;
- Loads from defrost heat gain into the refrigerated spaces;
- Evaporator fan and motor heat;
- Head pressure as a function of gas cooler specifications, control strategy, and ambient outdoor air conditions;
- Heat rejection load, which was determined by the cooling load and compressor heat;
- Compressor performance for a range of suction pressures, head pressures, and partial load conditions for variable speed machines, based on multivariate regression analyses.
System Details: The transcritical CO2 refrigeration system consists of a two-stage compressor rack design. All compressors are semi-hermetic recips. One compressor on each suction group is controlled with a VFD for trim. All constant speed compressors cycle on/ off to maintain suction. The low and high stage groups are operated at suction pressures of 212 psig and 441 psig, respectively.
Due to high compressor discharge temperatures, low specific volume, and high conductivity of CO2 refrigerant, the system is particularly well suited for waste heat recovery. The system includes a CO2 hot gas heat exchanger that sends a portion of the hot gas discharged from the compressors to dock reheat coils and evaporator hot gas defrost circuits. Hot gas is also used to heat glycol for the underfloor heating system and provide freeze protection for sprinkler riser rooms.
One adiabatic gas cooler rejects any heat loads in excess of heat recovery applications. It is capable of operating sub-critically or super-critically. Unlike a typical condenser, when operating supercritically, the gas cooler can reject sensible heat at constant pressure. Minimum head pressure is controlled to 638 psig for the system. Although water is consumed in adiabatic mode, the system still allows for large water, sewer, and chemical treatment savings when com pared with an evaporative condenser. Six freezer evaporators and two dock evaporators are included. Evaporator defrost cycles are initiated on an operator-defined schedule. Along with the refrigeration equipment comes a sophisticated control system capable of evaporator and gas cooler fan speed control, floating head pressure strategy, compressor sequencing, variable glycol pump control, and dock reheat control.
Energy Efficiency Measures: The following energy efficiency measures were analyzed for this study:
Dock dehumidification: Adding hot gas reheat coils on the dock evaporators to maintain low humidity levels in the refrigerated dock reduces the latent load in the freezer and allows for less frequent defrost cycles.
Efficient freezer evaporators: This measure increases the evaporator coil size, increasing capacity without increasing connected fan motor power.
Optimal evaporator fan control: Selecting EC motors provides a more efficient operation than AC motors. These motors also vary speed to maintain zone temperature setpoints. Fan motor power varies with the cube of speed, thus realizing significant energy savings whenever the evaporators are under part-load conditions. Evaporator fan motors vary speed from 36% to 90% of maximum motor RPM.
Gas cooler optimization: Selecting a gas cooler with additional heat transfer surface area allows for more efficient heat rejection. An adiabatic upgrade cools the incoming air during hotter weather to allow for lower condensing (or gas) temperatures, reducing compressor lift. EC motors are also recommended for improved efficiency and variable speed capability. Gas cooler fans vary speed from 10% to maximum motor rated RPM. A floating head pressure strategy is also included for optimum gas cooler performance.
Riser room heating: This measure comprises the installation of uninsulated glycol manifolds in each of the riser rooms, thus eliminating the need for electric unit heaters.
Glycol pump VFD: Using a pump VFD to vary flow in the glycol loop based on under- floor temperature setpoints saves pump energy whenever temperatures are satisfied.
High-speed freezer doors: Installing insulated, bi-parting freezer doors that rapidly open and close further reduce sensible and latent loads in the freezer. Door openings are triggered with motion sensors.
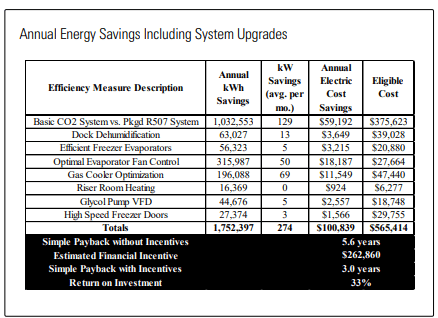
Energy Model Results: The energy study quantified energy savings by analyzing upgrades to the CO2 refrigeration system, in other words, a basic CO2 system was compared with a highly efficient CO2 system. The energy study also served to estimate financial incentives to offset the simple payback and improve the return on investment. Total energy savings for each efficiency measure is presented in the following table. Incentives are based on eligible costs and paid on either a $/kWh basis or a percentage of total project cost, the lesser of the two. Because this energy study was based on a new construction project, the eligible costs represent the difference between a baseline case and a high-efficiency option, not the full project cost. Please note that at the time of writing the following savings calculations are estimates and are awaiting verification.
For this paper, a comparison was also made with other system types, a halocarbon system and an NH3 system.
Halocarbon system energy use was modeled alongside the CO2 system. Annual energy use for each refrigeration component was calculated in the same manner: by building a ground-up refrigeration model to predict the cooling load for each hour of a typical weather year and using manufacturer performance data to estimate energy use. Not surprisingly, this is an inefficient system by comparison, but typical of the equipment. Much of the inefficiency is a result of simplistic controls and lack of heat recovery. This system consisted of the following:
- Packaged, air-cooled condensing units with R507 refrigerant;
- Remote piped evaporator air units with electric defrost;
NH3 design to date. We recently verified the annual energy use of the refrigeration system at this site funded by a similar utility-backed efficiency program. Again, the vast amount of data available made this site a worthy selection for comparison. A metric for annual energy use per conditioned volume was calculated and applied to the Grandview facility to estimate NH3 system energy consumption. The NH3 system includes the following features:
- Economized screw compressors, one with VFD for trim; • High-efficiency compressor oil cooling;
- Variable and automated volumetric index control;
- Evaporative condenser;
- Liquid subcooler;
- Remote piped evaporator air units with hot gas defrost;
- Dock air units with glycol feed reheat coils for dehumidification;
- Heat recovery used for under-floor system heating, freeze protection in sprinkler riser rooms, and evaporator defrosts;
- Variable speed evaporator and condenser fan motors;
- Optimally sized heat exchangers (evaporators and condenser);
- Low overfeed recirculated liquid evaporators to minimize NH3 charge;
- Liquid drainers; and
- A sophisticated control system capable of dynamic compressor sequencing, demand-based defrost initiation and termination, fan speed control, and floating suction and head pressures.
SYSTEM SUMMARY
R507 system: 2,620,859 kWh/yr
NH3 system: 717,652 kWh/yr
CO2 system: 868,462 kWh/yr
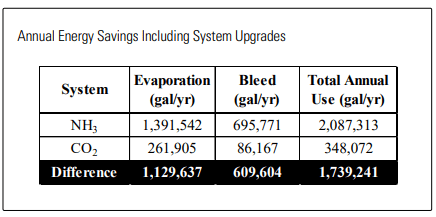
Additional savings are realized beyond energy. For example, the CO2 system relies on an adiabatic gas cooler (with a switchover temperature of 72°F) in lieu of an evaporative condenser typically found in industrial NH3. The following estimates are based on 3 gpm/100 TR and 3.0 cycles of concentration for bleed of an evaporative condenser