


Managing Your Energy Costs: It Can Be Done!
James Majsak, Construction Manager Crossnokaye (Santa Barbara, Ca)
ABSTRACT
All too often, energy management projects with good potential will fail for any number of reasons. Most of these failures will be a result of the project not addressing key requirements for success, or not meeting the expectations of all users throughout the organization. This report is intended to provide a 10,000-foot view on taking a holistic approach to energy management and reduce the risk of project failure.
The following topics will be discussed:
- Decoding Your Utility Bill – Unravelling the mysteries of electric utility bills and tariffs
- Energy Awareness – Understanding facility energy usage profiles
- Sub-metering – Justification and benefits of sub-metering equipment
- Energy Analytics – Transforming data into operational knowledge
- Refrigeration Industry Best Practices – Where are the energy savings opportunities?
- Project Development – Energy management project development best practices
- Selling It to Management – Presenting energy management projects for approval
- Evaluating Results – Confirming energy management project effectiveness
INTRODUCTION
The role of refrigeration Energy Managers has changed significantly over the years. In the past, a majority of energy management revolved around negotiating the best utility contract once every few years and making sure the budget supported the anticipated cost.
Changes in the amount of real-time data available from utility companies along with new technologies for measuring and monitoring energy usage have resulted in an opportunity for Energy Managers to take a more proactive role in reducing facility energy usage.
The energy management process now looks more like an ongoing cycle rather than the linear process it may have been in the past, as shown in Figure 1.
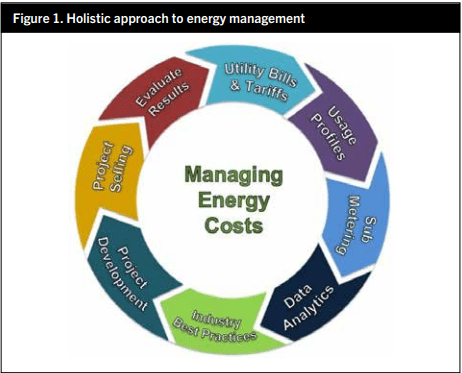
Taking a holistic approach to energy management will help ensure success for the energy manager, but it will also require additional effort to make sure all required areas of expertise are well-understood and all steps within the process have been completed. For this reason, it is always best to start with a simple energy efficiency measure as a pilot, and walk through the entire process end-to-end before attempting to complete more comprehensive energy management projects. The sections below provide an overview on each functional area of a holistic energy management approach.
DECODING YOUR UTILITY BILL
Utility bills are often not immediately decipherable upon first glance, but it’s important that Energy Managers dig into the details of these charges. Here are four good practices that can help develop a “facility profile.”
Educate Yourself on the Basics
There are two components that make up a majority of most utility bills and it is important to understand the difference between them. The first component is consumption, typically measured as kilowatt Hours (kWh) and the secon component is demand, typically measured as kilowatts (kW). Figure 2 shows an example of the difference between these.

With reference to Figure 2, the following points should be noted:
- Consumption (kWh) – A measurement based on usage over time. In the example above, running five 1,000- watt bulbs for one hour would result in 5kWh of consumption.
- Demand (kW) – A measurement based on peak consumption during a specific timed interval, typically 15 minutes. This can also be 30 or 60 minutes, depending on the utility tariff rules. For most utility tariffs, the highest demand interval during the month determines the billed peak demand. For the example shown above, the peak demand measured would be 5kW.
Another way to think about kWh vs. kW is to compare the terms to a car odometer and speedometer. If you were billed for driving the same way you were billed for electric usage, you would be given a monthly charge based on the total miles driven (like kWh) and another charge based on the top speed you reached during the month (like kW).
While there are many more minimal charges on utility bills, and many variations on billing of consumption and demand, the examples above should provide the basic understanding required to review your electric utility tariff and associate the majority of the costs to your monthly utility bill.
Read Your Entire Utility Bill
The next step in the process is to review your actual utility bills. The format and methods of billing for energy will vary greatly based on the suppliers and utility tariffs selected. In some areas, energy procurement is deregulated so you may have two separate bills for the same account, with each having their own method of billing. Figure 3 shows a typical utility bill with notes on the different types of charges.

Notes:
- The tariff code “TOU-8-D-RTP BIP” translates as “Time Of Use,” “Demand Charges,” and “Real Time Pricing” with “Base Interruptible Program” participation. This is very typical for an industrial account in a well-populated region of the country.
- The charges are segmented into “Delivery” and “Generation” classifications, as typically done for a deregulated market. Delivery is always provided by the regional utility and generation may be provided by either the regional utility, or a third-party supplier, as desired by the customer.
- The utility bill shown covers the dates of May 4 – June 3, so there are 28 days billed during the Winter season which ends on May 31 and two days billed during the summer season.
- Delivery demand charges are segmented in different rate periods, with separate charges for each period. This includes seasonal and time-of-day periods.
- The Department of Water DWR bond charge is intended to recover the cost of the energy needed to provide water services during an energy crisis period.
- This facility participates in a demand response program (BIP) and receives a credit on each utility bill for compensation.
- Generation consumption charges are based on real time price, which varies every hour of the month based on regional weather and electric supply capacity.
Know Your Utility Tariff
It may be noted in the sections above that there are numerous variables when it comes to how customers are billed for energy usage. The details behind each of the charges shown are usually not provided on the utility bill. These details are typically published in a utility tariff rate sheet, as required by state or federal regulations.
Most public utility companies will post their tariff rate sheets on their websites, where customers can find their specific tariff by referencing the tariff code shown on their utility bill. Smaller municipal utility companies, or municipal groups that purchase power from outside resources, will have similar tariff worksheets but typically show less details than the larger public utility companies.
Utility tariffs will typically provide information on the following functional areas:
- Applicability – Which customers can request a specific tariff, and limitations on minimum and maximum peak demand (kW) levels for participants.
- Territory – Geographic territory where the tariff is offered.
- Rates – Costs for consumption (kWh) and demand (kW). Typically broken down by time-of-day and seasonal rates, with options for delivery at different voltage levels.
- Time Of Day Details – Specific time of day peak and off-peak periods.
- Seasonal Details – Specific date ranges for changing seasonal charges.
- Demand Interval – Description of how demand is measured and billed. This may include specific clauses where monthly billed demand can differ from measured demand or be based on peak demand from previous months.
- Power Factor Charges – Additional charges for power factor below specific levels.
- Riders – Temporary charges added to specific tariffs to recover costs from other programs or events that had a significant impact on the cost of energy.
Read Every Line, Understand Every Detail
As anyone will quickly see once they start looking into tariffs, there are many variations in the methods of charging customers for their energy usage. For this reason, it is always important to not only understand the charges shown on your utility bill, but to also understand conditions that may change the way you are billed from month to month. Below is an example of this:
Tariff:
Eversource Connecticut Rate 057 – Large Time-Of-Day Electric Service Manufacturers
Clause: “Distribution demand shall be the highest average 30-minute kilovolt- ampere (kVA) demand in the current month or the preceding eleven (11) months. The customer may, upon not less than three (3) months’ prior written notice to the Company, decrease the Distribution Demand ratchet solely to reflect lower load levels resulting from demonstrable conservation and load management.”
Impact:
- If the customer had a peak demand reading the previous month that exceeds the current month’s value, they will be billed at the previous month’s level for the current month as well as the next 11 months if no higher demand is recorded. This is known in the industry as a “demand ratchet” clause.
- If the customer takes conservation measures to reduce peak demand, they can request the demand ratchet be reset after only 3 months, saving 8 months of excessive charges.
As shown above, if a customer had never reviewed their tariff or understood the details behind their billing, they may have implemented a demand reduction project with no financial impact for the first 11 months and would not have known they could reset their billed demand after three months.
ENERGY AWARENESS
It’s important to understand not only how your facility is billed for energy usage, but also how your facility consumes energy throughout the year.
Understanding Your Facility Profile
The best way to do this is by reviewing historical usage data over the last 12 months to understand not only how your facility operates on a month-to-month basis, but to also understand the impact of any weather or seasonal changes.
There are three basic methods for doing this:
- Compile the kWh and kW reading provided on each monthly utility bill.
- Request summary usage data from your utility. This may come as monthly, daily or hourly data depending on your meter type and the capabilities of the utility company.
- Request interval meter data if your facility has an interval meter. This can typically be confirmed by the presence of an LCD display on the meter showing kW data. The resolution of the data will match your demand interval of 15, 30, or 60 minutes.
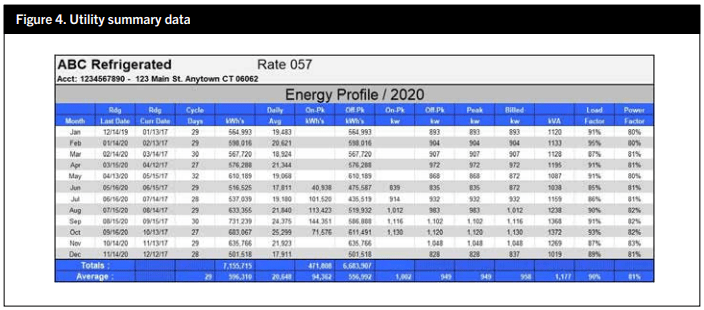
While the first two methods of collecting summary data will be much easier to achieve, they will only provide data that shows a simplified overview of your energy usage. Figure 4 shows an example of summary data delivered by a utility:
The third method of requesting interval data will provide the greatest resolution and show all peak events that impact your utility costs. Interval data is typically delivered to the customer as an electronic data fille, in CSV format. This is due to the large number of data points. For example: If the facility is billed on 15-minute demand intervals, they will receive 96 readings per day, 35,040 readings for the entire year.
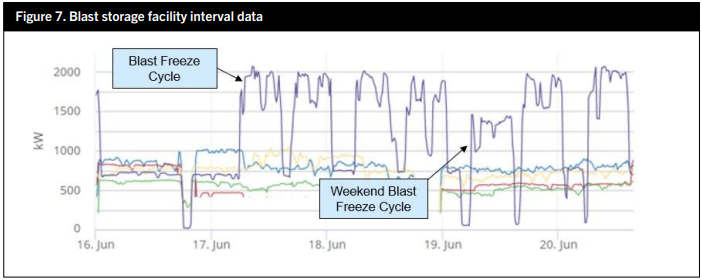
Once the interval data is received, it can be imported into a variety of applications for analysis. Excel is a very popular and powerful tool for interval data analysis with the ability to add additional formulas, conditional formatting, and data graphs. Figures 6 and 7 show examples of graphing demand (kW) interval data for two facilities.
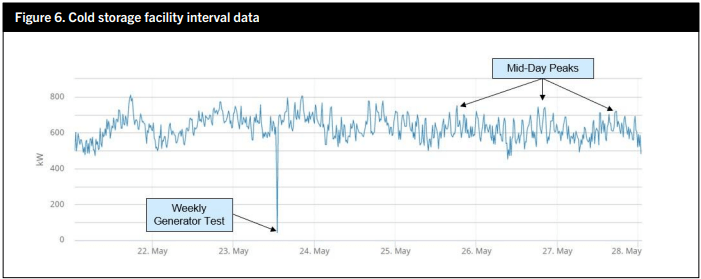
Cold storage facilities will typically show a repeatable pattern of energy usage day-to-day with seasonal trends of increased and decreased usage as the outside temperature varies. Any peaks occurring outside the normal patterns of usage should be investigated for energy efficiency opportunities.
Facilities with manufacturing processes such as packaging and blast freezing will show a less-repeatable usage profile. Changes in operations and the combinations of equipment running different times will result in a varied usage pattern with profiles from the larger loads being recognizable. While there may be changes in the facility’s baseline usage during evenings and weekends, the usage profile shapes of the larger loads may remain the same.
SUB-METERING
While electric utility data provides an overview of energy usage from a utility billing perspective, sub-metering data will provide a more granular view as well as the impact individual loads have on overall energy usage.
Taking A Deeper Look
This data is valuable for a number of reasons:
Energy Awareness – Sharing of energy data for specific departments across the organization
Usage Allocation – Energy usage accountability for individual equipment or systems Utility Bill Verification – Comparison of totalized usage against monthly billed values Operations – Ability to measure the impact of operational changes on energy usage Equipment Performance – Monitoring of real-time energy usage for inconsistencies Asset Utilization – Tracking of run-hours and utilization for individual assets
Continuous Commissioning – Platform for M&V data and identification of new opportunities The increased granularity of submetered data also allows for a much more powerful graphics that show the relationship between individual loads and their impact on overall usage. Figure 8 shows a typical graph from a sub-metered facility.
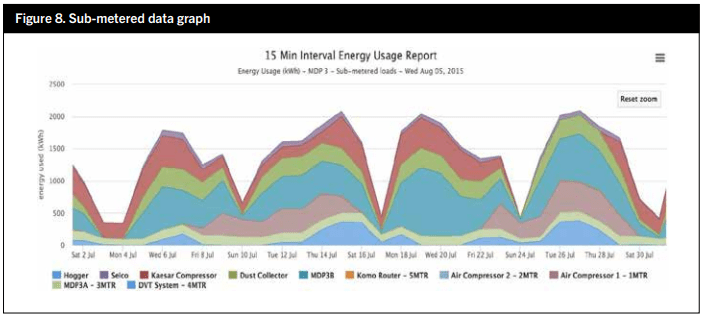
Another side benefit of sub-metering at the facility above was the ability for management to better understand how often specific equipment was in operation, which helped make better decisions on production bottlenecks, equipment capacity and scheduling issues.
Beside energy managers, there are many other groups inside, and outside, the organization that may find access to sub-metered data valuable for a variety of reasons. This includes the following:
Internal Resources – Maintenance, Engineering, Accounting, Facility Management and Corporate Management.
External Resources – Utilities Companies, 3rd Party Energy Suppliers, Energy Efficiency Companies, Engineering Firms/Contractors and Customers ISO 50001 Quality Managers. Very often during submetering projects, there will be an unanticipated view of usage that provides value never considered in the original project plan. A good example of this was an accounting department that compared historical electric usage data to their operations schedule to accurately predict what the utility bill would be 2 weeks into every month. This provided a “crystal ball” view of future energy costs, which helped manage facility expenses.
DATA ANALYTICS
While the previous sections outlined of the benefits of reviewing metering data, the next step is to perform an ongoing analysis of data for comparison against previous readings and correlation with data from other sources.
Transforming Data into Insights
The challenge in doing so is the need to work with very large amounts of data and the challenge of finding meaningful relationships between data sets that can provide insights. This is the role of an analytics software package.
The reason such packages exist is because manually interpreting data is a time- consuming process that often provides false results, due mainly to a human tendency to see connections and patterns where there are none. The formal term for this condition is “apophenia,” and it is illustrated by the amusing images in Figure 9. The same goes for energy data trends.

There is a difference in the capabilities and roles of data collection vs. analytics. A favorite expression is that “a good data collection package will allow you to dig through the numbers to see what happened, while a good analytics package will tap you on the shoulder and tell you when and where to look.”
An effective data analytics package will provide the following:
- Analysis of both real-time and historical usage data
- Correlation and normalization of data from different data sources
- Automated identification of events hidden within large amounts of data
– Usage patterns
– Deviations & Failures
– Opportunities for improvement - Graphical reporting with a simplified view of complex issues
- Automated delivery of standard reports, KPI’s and scorecards
It’s All About the Rules
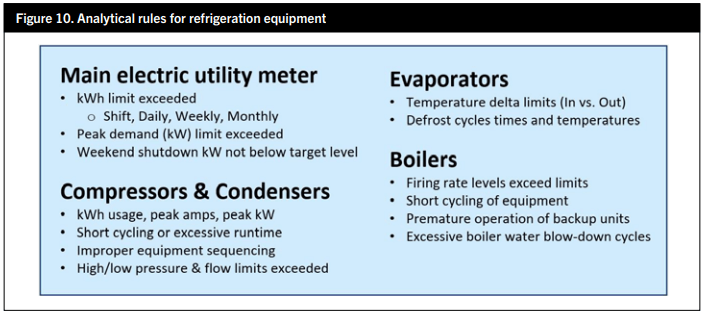
One of the most important features of an effective analytics package is the ability to define custom analytical rules to be applied against data to automatically identify critical events. Users should have the ability to define limits and functions that allow them to identify when equipment is running outside normal operational levels and trigger notifications before failure occurs. Figure 10 lists some examples from a typical refrigeration facility.
INDUSTRY BEST PRACTICES
Once you have the knowledge and data required to understand the presence and cost of inefficiencies, the next step is to identify the possible causes and take action.
What’s Everyone Doing?
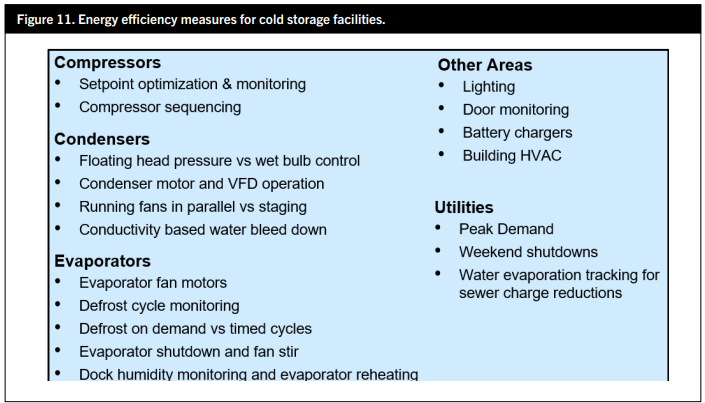
Figure 11 shows typical energy efficiency measures being performed at cold storage facilities.
Advanced Control Strategies
In addition to the measures above, recent advancements in refrigeration control systems have allowed for the development of specific energy saving strategies. This includes the following:
- Setpoint Optimization
- Automated Demand Stabilization
- Thermal Load Shifting
- Realtime Price Response
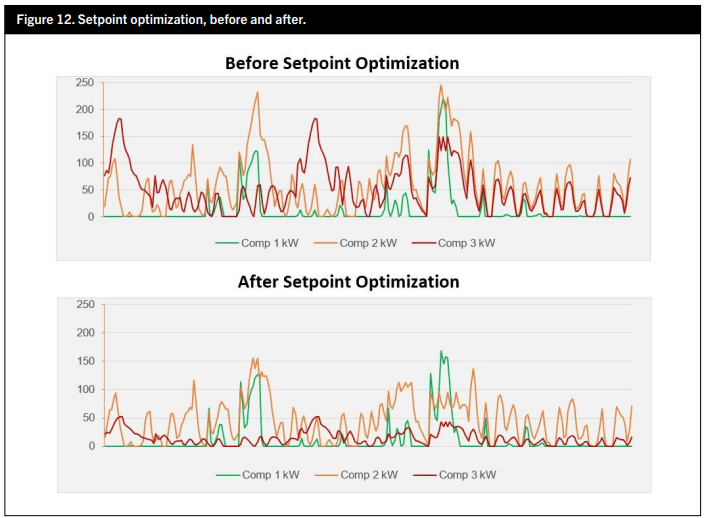
Setpoint Optimization
Setpoint optimization consists of monitoring the relationship between equipment running in coordinated groups then confirming each piece of equipment is coming on, and going off, at the proper time. Significant spikes in energy usage point towards a system that is possibly responding too quickly to process changes. Multiple pieces of equipment found running below their maximum capacity may be a sign of setpoints for groups of equipment being too close to each other. Figure 12 shows peak demand trends before and after a setpoint optimization project.
The results of the project shown in Figure 12 are:
- Reduced overall peak demand, from 243 kW to 155kW (36.2% reduction)
- Reduced load factor (peaks & valleys) for more consistent operation of equipment
- Comp 1 and 2 are now handling most of the plant load
- Comp 3 is now running as a trim compressor with minimal runtime
Automated Demand Stabilization
Automated demand stabilization is the reduction of peak demand to a predetermined setpoint level. Performing a review of interval data and graphing demand (kW) over time will identify the opportunity for demand reductions (Figure 13). A facility with significant “peaks and valleys” in the data will be a good candidate. “Peaks” identify excessive usage, such as multiple facility loads running at the same time. “Valleys” identify intervals that loads can be shifted into by reducing their usage during a peak interval and recovering during the next interval.
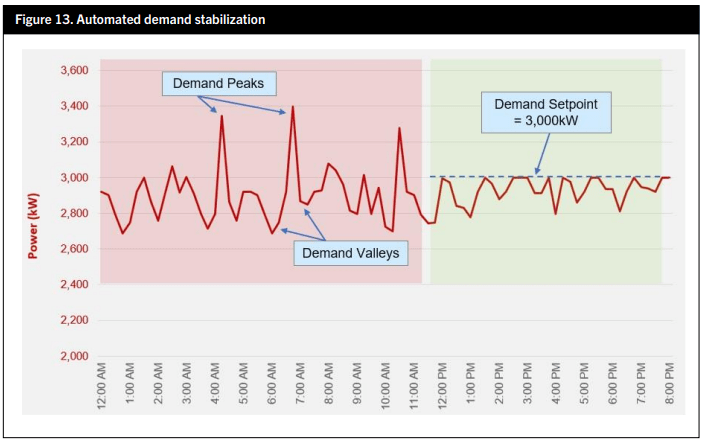
One thing that cannot occur is constant reductions across all demand intervals. For this reason, if the facility has what is called a “flat” profile with minimal peaks and a consistent demand level, it may not be a good candidate for a demand stabilization project.
In most cases, demand stabilization can be achieved without any impact on facility operations or product quality. In the case of cold storage, product temperature should be monitored during load shedding operations to ensure there is no impact on stored product quality.
The results of the demand stabilization project shown in Figure 12 are:
- Reduced overall peak demand from 3,400kW to 3,000kW (11.46%)
- Reduced monthly demand charges of $3,884 ($9.71/kW * 400kW Reduction)
- No impact on facility operations or product quality
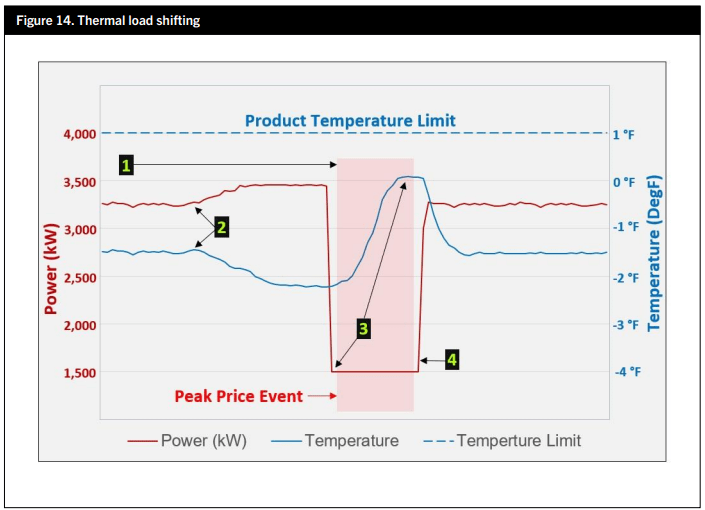
Thermal Load Shifting
Thermal load shifting is a proactive approach to avoiding peak cost events. This strategy is specific to the cold storage industry, where energy can actually be stored by overcooling product then reducing equipment operation to ride through peak price events.
An important requirement for this strategy is to monitor product temperature as a load shedding constraint to protect product quality, but there is still a good opportunity for significant savings even if you cannot load shed throughout the entire event.
Figure 14 illustrates the following steps of a thermal load shifting strategy:
- A peak price event is identified by either utility notification or the monitoring of regional generating capacity and real-time pricing for the day of operation.
- Over-cooling of product begins prior to the event start time, while energy cost is low.
- The optimal energy reduction level is calculated to maximize reductions while protecting product during the event.
- Energy is restored to normal operating levels once the event has ended, or if product temperature exceeds a setpoint limit.
Real-time Price Response
Figure 15 shows a successful attempt by a cold storage customer to reduce peak demand during an 11-hour peak price event. This customer was on a real-time price tariff with day-ahead notification of the following day’s costs.
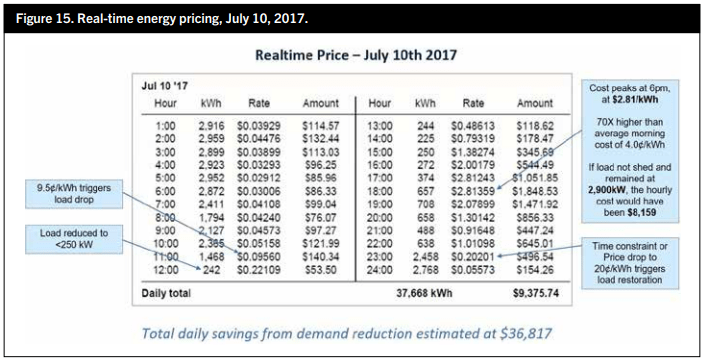
- The customer was able to reduce the facility load to a value below 250kW for the first four hours of the event.
- During the next seven hours of the event, the customer was required to expend some additional load, but still maintained peak demand below 708kW.
- During hour 23:00, the price was still high but the customer was needed to restore energy usage to normal levels to protect product.
- The estimated savings for the customer’s price response was $36,817 for the day.
One interesting fact is that this data was from July 2017. While reviewing data for the same site from May 2020, a similar price peak occurred, but no action was taken! This may have been a manual response or a failure to understand that an automated system was no longer operational, but it is a good argument for continuous commissioning where energy management measures from the past are validated on a regular basis.
PROJECT DEVELOPMENT
So now we have a good understanding of utility billing and the facilities usage profile. We may have also installed submetering to better define the opportunity and have reviewed the data. We have a good understanding of industry best practices and control strategies and are now ready to develop a project! Now what?
Set Expectations Soon and Often!
A good first step is to interview each person the project will impact and ask a few leading questions. This approach has a dual purpose. It allows you to get initial feedback on your project design, and also set users expectations on the benefits of the project. “Leading questions,” should be designed to answer your basic assumptions as well as letting end users realize what they don’t know. Here are a few examples:
Employee Performance
- Which area of the facility currently operates most efficiently?
- Which team is best at maintaining proper setpoints on their equipment?
- Which department is best at performing shutdown procedures nights and weekends?
- Is energy included in production metrics, like kWh/pound or kWh/pallet?
Facility Management
- Which facility loads use the most energy?
- Which facility loads are most impacted by changes in weather?
- Is energy metering part of any condition-based maintenance routines?
- Which systems have the most, and least, amount of downtime?
Operations
- Are there areas where seasonal products impact energy usage?
- What past operational changes have resulted in increased or decreased energy usage?
- How does this facility’s energy usage compare to other similar sites?
- How does management current measure changes to trends in energy usage?
Know Your Costs – All of Them
Having an accurate estimate of all costs is a very important part of project development. Initially, the project return on investment (ROI) reviewed by management will be based on total project costs. Miscalculating these costs might result in a loss in future funding if your project has overruns and does not meet the proposed ROI.
It is also important to understand the difference between “direct” and “indirect” costs. Direct costs are typically the items you would expect for the implementation of most hardware and software products within a facility. Indirect costs are labor-based tasks related to an energy management project that are required to ensure project success. Figure 16 shows examples of both types of costs.
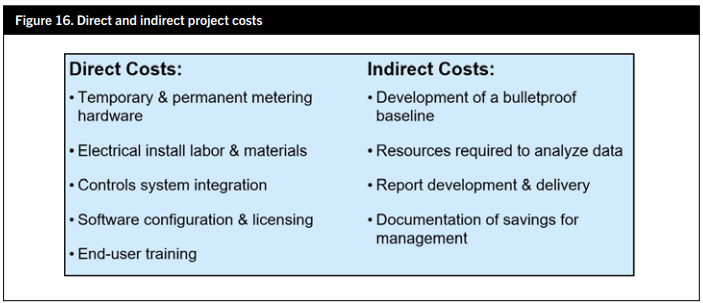
The indirect costs may appear to be “nice-to-haves,” but they are actually critical to project success. Developing a bulletproof baseline is essential because this defines the point where all project performance will be measured from. One of the most difficult things to do is negotiate where savings should be measured from after they have already been implemented.
Analyzing data properly can be a labor intensive and time-consuming process. Using an off-the-shelf analytics package is often the best solution, but software and licensing costs should be considered as well as the labor required to input the data and present results. Reporting is an important step in promoting project success and lays the groundwork for future measures.
Pushing data or delivering reports to users across the organization on a daily, weekly, or monthly basis will keep everyone active and engaged in the facility’s energy management strategy.
Documentation of savings for management should be done outside of standard reporting. This is typically done on a quarterly basis, with the focus on energy costs reductions and trends in usage changes.
Now Sell It!
Once the project has been developed it is time to start selling. Why is this required? Some of the best projects never get off the ground because stakeholders are not aware of the impact of the project, or their expectations have not been properly set. It is important to be proactive and take the following steps before requesting project capital:
- Do your homework and investigate
- Develop a Return on Investment (ROI) strategy
- Clearly communicate the benefits
Do Your Homework and Investigate
Investigation consists of understanding how your project will be perceived by all those involved in approving it. The following list is a sample of questions you should have the answer to before proposing a project:
- Is the project in line with the company’s strategic objectives?
- What existing problems does the project address?
- What resources are required for the project?
- What is the personality, role and internal politics of each project approver?
- Who are the decision influencers outside of the project approvers?
- What is your credibility with management?
- What will be the sources of any possible objections to the project?
- Who will receive benefits from the project?
- What are the financial and operational risks of not doing the project?
If any of the questions developed during the investigation phase cannot be answered, it would be a good strategy to hold off on proposing the project until they can be. This is where the selling takes place, and you will most likely modify the scope of the project after speaking with the people needed to answer these questions. This will also provide a good opportunity to set everyone’s expectations before the project is proposed.
Defining ROI
For energy efficiency projects, defining ROI can be a challenge. For simple prescriptive measures, like lighting projects, the savings are a matter of swapping old lamps with replacements that consume less watts. Determining the savings is a math problem.
For other types of energy efficiency measures that involve refrigeration and process controls, the impact of measures can be unclear and hard to measure, since it can be difficult to understand how the system would have continued to run without them. In these cases, a strategy of presenting ROI in qualitive terms instead of quantitative can be very effective. This can include the following approaches:
- Present the project as an investment, not an operational cost reduction.
- Address the fact there may be no clear ROI, with savings based on taking measures to address unexpected insights.
- Document savings expectations as ranges.
- Calculate a break-even timeline and describe how it will be tracked.
- Document the indirect benefits beyond utility cost savings. Include increased equipment reliability and fault avoidance opportunities.
- Reference similar project results from trade magazines, industry articles and DOE studies.
Effective Communication Is the Key
When presenting the project, make sure you clearly communicate the benefits. Below are a few strategies for doing this: The simpler the better – Clearly define the opportunity in simplified terms with credible data. Develop a value statement – Summarize the direct & indirect project value. Present a risk statement – Present your knowledge of the project risks and steps that will be taken to avoid them, as well as recover if they do occur. Use Visuals – Show savings opportunities in a graphical format. People tend to recognize and retain images more easily than words. Sell It – Let your passion and enthusiasm show! If you come across as a true believer and advocate, management knows they are in good hands.
EVALUATING PROJECT EFFECTIVENESS
Once the project has been approved and the new measures are in place, what is the best way to determine the effectiveness? The answer to this question depends on your definition of effectiveness. For energy efficiency project, this is commonly measured as overall energy reduction or cost savings, but there are other items that should also be monitored to confirm the project is a success and the savings will continue:
- Review the measurement and verification methods used to document the savings.
- Evaluate what value the system is providing beyond energy cost reduction.
- Review the reports and dashboards made available to users. Confirm they are effective and understood by users.
- Work with management to promote energy data as part of their everyday decision- making processes.
- Confirm e-mailed reports are effective and reviewed by users.
- Identify future opportunities for expanding energy management.
The best method of making sure the above items are addressed is to designate a “Project Champion”. This will be an individual that has the skills, time and patience to work with all end users to confirm project effectiveness. You may also have multiple champions working across different departments of the organization, but the goal is the same. Remember, an energy management project is about understanding energy usage and not the technology, data and really cool analytics behind the final report presented to management. Users may not be technical and need systems that they can easily use and understand, with basic terms that relate to their job function.
Some people may need more than just the bottom line. In these cases, don’t provide only data and hope they will develop their own insights. Create graphics with simplified narratives explaining why the data indicates an opportunity for energy savings or confirms the effectiveness of measures already taken. If you find that management is not making energy data-driven decisions, provide an easy to access dashboard and push timed reports on a daily, weekly, monthly, or quarterly schedule to promote awareness.
CONCLUSION
Holistic energy management is often a repeating process of continuous commissioning. Many measures taken may not remain in place for extended periods of time, or facility systems may change while the energy efficiency measures in place remain the same. Changes in utility costs or tariff availability may also make some measures previously taken less cost effective, or make measure not taken in the past suddenly more attractive. For these reasons, it is always a good practice to run past projects through the processes outlined in this document on a regular basis to confirm the value is still being captured, and no new opportunities are being missed.