


Energy Performance Benchmarking: Considering the Efficiency of an Ammonia Refrigeration Installation
Stefan Jensen, SCANTEC
The number of countries ratifying the Kigali Amendment to the Montreal Protocol is steadily growing.In 2016 in Kigali, Rwanda it was agreed to phase down hydrofluorocarbon (HFC) refrigerants for environmental reasons. The amended Montreal Protocol is the instrument that will make this happen.
In November 2016, the Paris Agreement entered into force. The Paris Agreement is a legally binding international treaty on climate change. At the time of writing, 190 Parties out of 197 Parties to the Convention are Parties to the Paris Agreement.
The goal of the Paris Agreement is to limit global warming to well below 2°C (3.6F), preferably to 1.5°C (2.7F), compared to pre-industrial levels. The science and the politics that have led to these agreements are therefore obviously considered conclusive. Within polities across the world, legislation and regulations are or have been evolving that reflect the above two global initiatives.
For practitioners within the refrigeration industry, the time for questioning what has led us all to this point has passed. It is now necessary to focus our combined efforts and expertise on the responses to the new regulatory and legislative environments that either are or will be realities soon.
The ammonia refrigeration industry, which already uses one of the most energy efficient and environmentally benign refrigerants available, does not have to concern itself with too many of these energy conservation initiatives, right? Wrong.
Is this as good as it gets? Is the ammonia refrigeration industry as energy efficient as it can be? If not, how is the energy conservation potential of ammonia refrigeration plant generally (existing as well as new) quantified, and how is this potential realized?
Ammonia refrigeration plants are employed in a variety of different applications. To shed light on some of the questions raised above, mixed refrigerated warehouses have been used as a sample application in the following. Refrigerated warehouses have been the subject of numerous energy performance analyses by many researchers over several decades. There are not many analyses, however, that mainly focus on ammonia refrigeration plant.
Secondly, the results of the published analyses have, with few exceptions, been grouped to show designers and users average energy performance practice as opposed to best practice energy performance. If users and designers examine their key performance indicators and determine that they fall within the average industry practice bracket, it is tempting to conclude that the plant they possess is indeed as good as it gets.
It is, however, the difference between average industry practice and best practice energy performance that will provide a measure for the energy conservation potential of a particular application.
So, what is the best practice energy performance for an ammonia refrigeration system servicing a refrigerated facility? Generally, the energy performance of a refrigerated warehouse is measured in kWh per unit refrigerated volume per year or kWh. m-3. year-1 (kWh. ft-3. year-1). This is also referred to as Specific Energy Consumption (SEC). Figure 1 provides examples of recorded SEC-values. The color-coding of the performance values is self-explanatory. The systems represented by the yellow dots are highly energy-optimized, dual-stage ammonia refrigeration plants with screw compressors and liquid overfeed. These systems were designed and constructed between 1999 and 2013 by one refrigeration contractor for one client.
What is noteworthy in relation to Fig. 1 is the spread between the SECvalues. Some of this spread is of course explained by differences in peripheral conditions and differences in the ways the individual warehouses are operated.

What is also evident is that the SECvalues of certain plant types form a significantly closer and more predictable cluster than others. This is the case for the systems represented by the green dots.
The green dots characterize refrigeration plants with a significant focus on superior part load energy efficiency. This translates into multiple smaller compressors, extensive use of rotational speed control, and detailed optimization of the operating envelopes of the individual heat exchangers throughout the systems.
The plants represented by the green dots are also not penalized by the presence of relatively heavy liquefied refrigerant in the suction lines/risers. Particularly at part load, the presence of liquefied refrigerant in suction lines and risers can cause very significant line pressure drops and serious energy performance penalties.
Within Fig. 2 is illustrated an achievable best practice energy performance benchmark. The benchmark is based on recorded SEC-values of ammonia refrigeration plants operating in the field.
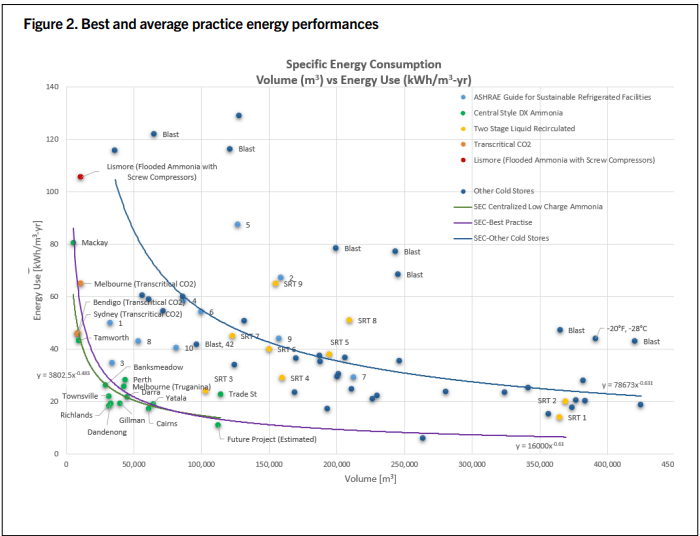
The graph for the best practice energy performance benchmark is SEC=16,000V-0.61 kW. h-0.61 m-3*. year-1 where the refrigerated volume V is inserted in m³. The blue graph SEC=78,673V-0.631 represents average practice for the facilities recorded in this example. The vertical distance between the two graphs represents the energy conservation potential. For a 100,000 m³ (3,531,467 ft³) warehouse, the energy conservation potential is 55-14.3=40.7 kWh/m³*a (1.15 kWh/ft³*a) or a 74% reduction.
So, what explains the recorded spread in SEC-values aside from variations in peripheral conditions? This can be answered in one sentence – lack of attention to overall system energy performance at partial load. Let us have a look at some practical examples.
The first one is a conversion of a small 5.250 m³ (185,400 ft³) refrigerated food service facility from air cooled, single stage R404A based condensing units with electric defrost to a dual stage centralized, low charge NH3 plant with hot gas defrost and evaporative condenser. The recorded reduction in SEC is 57 to 71% depending on the time of year and plant control settings.
The second example is the replacement of an existing NH3 plant with two single stage economized screw compressors, gravity flooded refrigerant feed, hot gas defrost and evaporative condenser with a dual stage, centralized, low charge NH3 plant with reciprocating compressors and hot gas defrost – refrigerated volume 10,000 m³ (350,000 ft³).
The before/after annual operating expenses (sum of energy and maintenance costs) are $275,000 and $83,000 respectively. The simple pay-back is five years.
The third example is a 60,000 m³ (2,119,000 ft³) refrigerated distribution facility with 300 tons/week blast freezing capacity. Based on the first electricity account after commissioning, the new facility features 57% lower annual energy costs ($370,000 versus $865,000/year) than the almost identical neighboring facility serviced by a conventional liquid overfeed NH3 plant.
It is anticipated that this initial energy performance advantage recorded for the third example will increase further as steady state conditions are established within the new facility. The tasks that lie in front of us all are clear, but not necessarily easy. Collectively, we need to examine our past performances within the area of energy efficiency engineering as applied to industrial refrigeration, identify shortcomings, and improve.
This will no doubt challenge some well-established conventions, but there is not anyone better at challenging what we do than ourselves. Collectively, we clearly have what it takes to do this job. In IIAR we have an excellent forum for information exchange. We must start this journey now. The time is right.