


COMPARING EVAPORATIVE AND AIR COOLED CONDENSING FOR AMMONIA SYSTEMS
DOUG SCOTT VACOM TECHNOLOGIES LA VERNE, CALIFORNIA
Editor’s Note
For ammonia refrigeration systems, evaporative cooled condensers are the most common technology in use today. But increased water costs as well as reduced water availability in many areas are making water conservation an important component of sustainability efforts for many companies. In this technical paper, the author compares evaporative cooled condensing and air cooled condensing for an ammonia system in a refrigerated warehouse in six U.S. cities. The comparison uses detailed hourly simulation of the refrigeration plant and local electric and water rates. The primary effort of the analysis work focuses on energy usage and electric costs, since this is the greatest “unknown” in considering air cooled ammonia systems. The most intriguing value of air cooled ammonia systems may be as an alternative to other refrigerants, changing the default assumption that air cooled condensing requires halocarbon refrigerants. However, the scope of this technical paper is limited to ammonia, to provide a focused comparative analysis of energy use and costs between evaporative and air cooled condensing methods.
The author of this technical paper will present a follow-up paper on this subject at the 2016 IIAR Conference in Orlando, Fla., where he will provide additional case study analysis with new information on alternate refrigerants. The author will include broader climate region data and comparative equipment cost as part of the analysis.
ABSTRACT
Ammonia is the ideal industrial refrigerant, with high efficiency and broad utilization in industry, as well as attractive environmental properties. Use of air cooled ammonia systems is uncommon, though, with almost all ammonia systems employing evaporative condensers, based on past practice and assumptions concerning efficiency and system performance. The efficient use of air cooled condensing could allow the benefits of ammonia to be realized more widely. This paper studies efficiency and utility cost of a refrigerated warehouse using an ammonia refrigeration system in six U.S. cities, comparing evaporative and air cooled condensing.
INTRODUCTION
Ammonia refrigeration systems use evaporative cooled condensers almost exclusively. Due to the large size of most ammonia systems, historical context, and industry perceptions regarding performance and efficiency, air cooled condensing is seldom considered for ammonia.Increased water costs as well as reduced water availability in many areas are making water conservation an important component of sustainability efforts for many companies. This paper compares evaporative (evap) cooled condensing and air cooled condensing for an ammonia system in a refrigerated warehouse in six U.S. cities. The comparison uses detailed hourly simulation of the refrigeration plant and local electric and water rates. The primary effort of the analysis work focuses on energy usage and electric costs, since this is the greatest “unknown” in considering air cooled ammonia systems.
The most intriguing value of air cooled ammonia systems may be as an alternative to other refrigerants, changing the default assumption that air cooled condensing requires halocarbon refrigerants, historically HCFC-22 which is currently being phased out, and more recently HFC refrigerants which are under pressure to be phased down. However, the scope of this study is limited to ammonia, to provide a focused comparative analysis of energy use and costs between evaporative and air cooled condensing methods.
BACKGROUND
Ammonia is the dominant refrigerant for industrial refrigeration systems due to its low cost and availability of ammonia, its attractive thermodynamic and its physical properties, resulting in high system efficiency. Evaporative condensing has been the standard for ammonia systems, with almost no use of air cooled condensers.
The higher design pressures required for air cooled systems, affecting compressors, piping, valves and vessels, has limited equipment availability and has been a significant cost consideration. During compression ammonia produces high actual discharge temperatures, which are exacerbated by the higher discharge pressures with air cooled systems. While not a concern on screw compressors which use oil or liquid cooling during compression, this characteristic becomes more apparent and more difficult to address with reciprocating compressors. This, in addition to higher operating pressures, helps explain why air cooled condensing has had little historical use in ammonia systems.
STUDY DESIGN
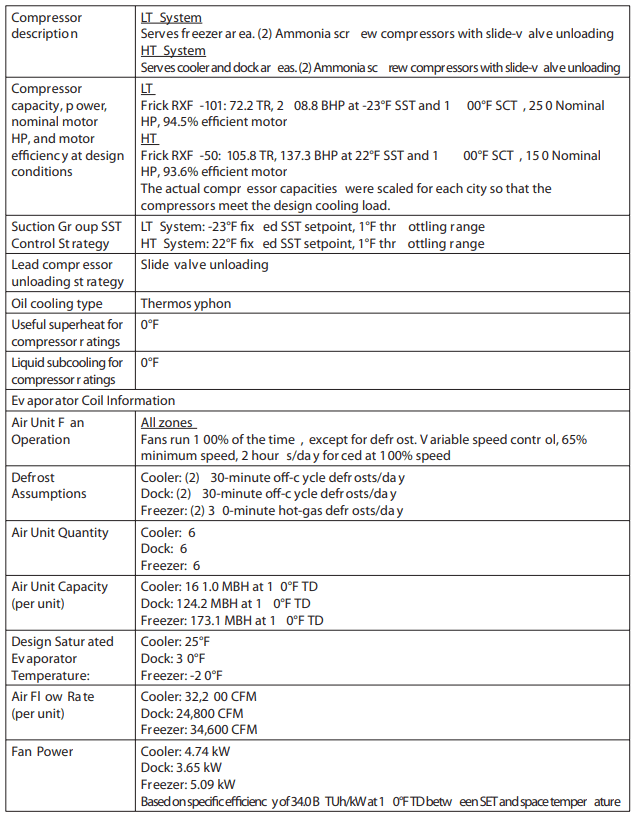
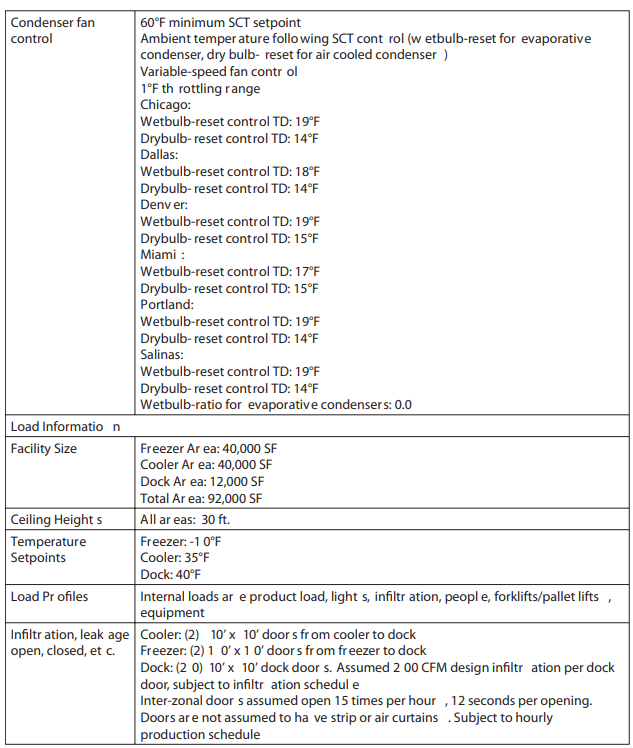
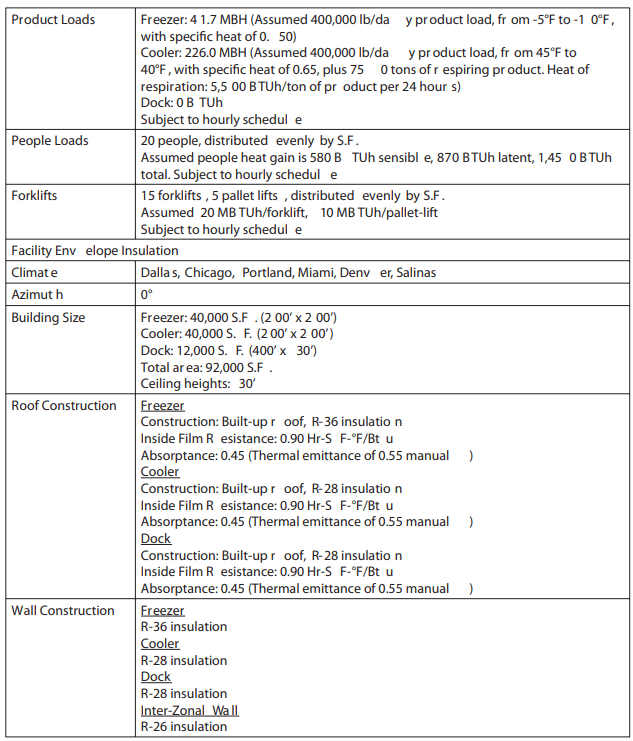
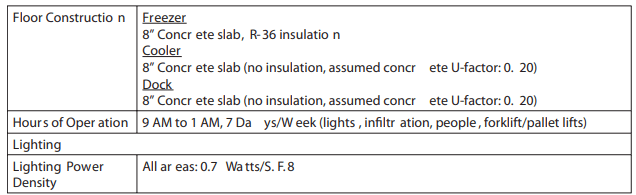
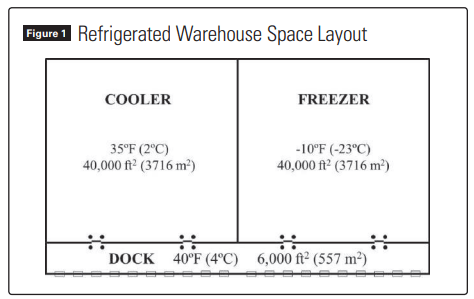
For this study, a medium sized refrigerated warehouse was employed, as shown in Figure 1, with freezer, cooler and dock spaces. The ammonia refrigeration system uses two suction levels, each with two equal-size screw compressors. The design assumptions and equipment selections are shown in Appendix I.
Six cities were used for the study, primarily to obtain a range of weather conditions. Since there is no particular correlation between weather conditions and electric rates across the country, the comparison of annual energy consumption provides the most relevance in understanding the effect of climate on the two means of condensing.
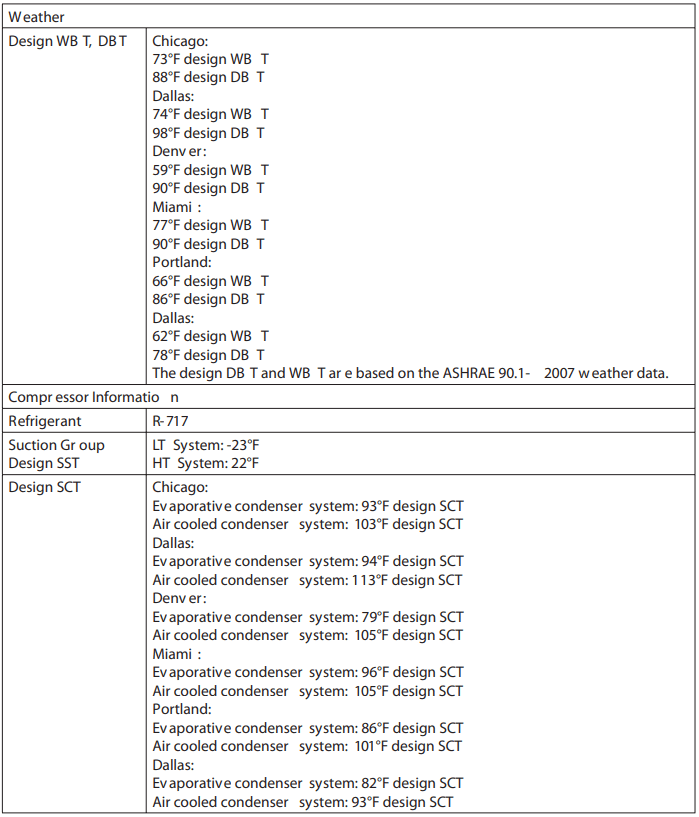
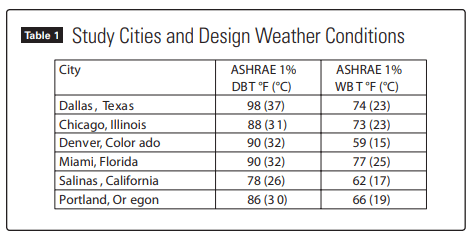
In addition, the local electric and water rates for the subject cities were used to provide examples of actual operating costs. Table 1 shows the six cities along with the ASHRAE1 design dry bulb temperature (DBT) and wet bulb temperature (WBT)conditions. Local utility costs for electric and water usage were used to provide realistic economic examples but are only examples since electric and water rates could vary greatly within a given climate selection.
Condenser Selection
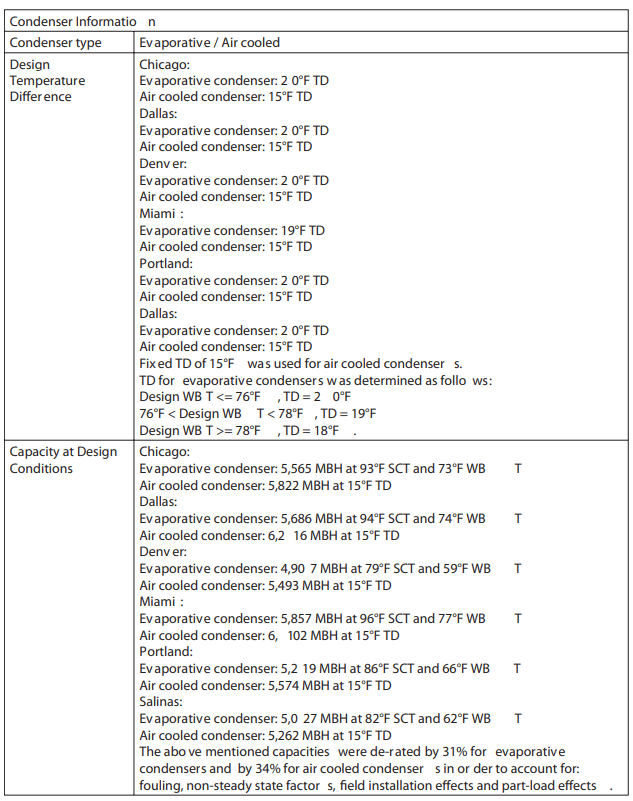
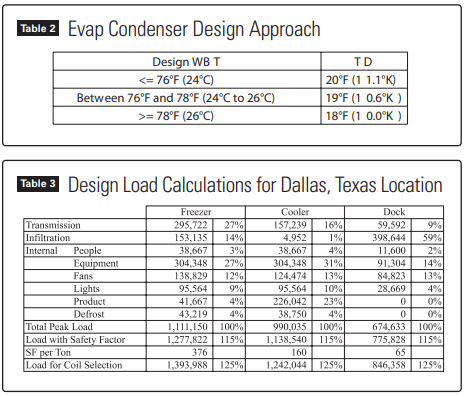
The evap cooled condenser selections for each location were made using the compressor total heat of rejection (THR), based on compressor capacity, and using the approach (i.e. temperature difference or TD) between saturated condensing temperature (SCT) and entering wet bulb temperature, as shown in Table 2. These condenser approach values are equivalent to the minimum requirements in the California Title 24 Standards for new refrigerated warehouses. The closer approach (lower TD) at higher design wet bulb temperatures (WBT) does not mean a condenser is necessarily larger as a result of the closer approach; rather the lower TD reflects the physics of moist air and the fact that condensers have greater capacity at the same approach as the WBT increases. This effect can be observed in the heat rejection capacity factor tables provided by all manufacturers of evaporative condensers for selection at specific application WBT and SCT conditions2. Thus the approach would be lower even for a same-size condenser and the same THR and a higher WBT. Industry practice often specifies condensing temperature rather than approach temperature, which can result in condensers being oversized or undersized, at least from an energy efficiency standpoint. Specifying the approach is more consistent in terms of overall system energy efficiency and the goals of this study.
The air cooled condenser selections were based on a 15°F (8.3°K) approach between SCT and entering dry bulb temperature (DBT). The air cooled design approach is the same for all ambient conditions.
The assumed approach temperatures directly determine the size of the condenser, and thus affect the results of the study. These sizes are considered to be a reasonable balance of energy efficiency and cost effective sizing that could be applied across numerous climates. Note this condenser sizing is not intended to be a comprehensive design recommendation; in actual system design for a particular facility, climate and utility costs, the optimum condenser may be smaller or larger.
Load Calculations
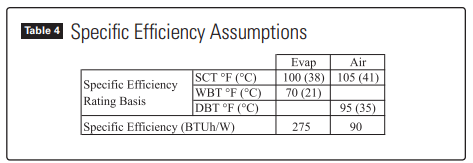
Cooling design loads were calculated for each location, including envelope, infiltration and internal loads. The design loads, in BTUh were used to select compressors and condensers. A summary of the loads for one location, Dallas, Texas, is shown in Table 3.
Note that the hourly cooling loads calculated for hourly system modeling and energy analysis are based on weather files and operating assumptions, and are not based directly on design loads.
Compressor Selections
To minimize unintended part load effects, the compressors for each location were size-adjusted from a single representative base compressor model each for the low and high temperature suction levels. In other words, the compressor size was made to exactly match the desired capacity, to avoid unintended part load effects that would be caused by limiting selections to actual compressor models. Part load operation assumed slide valve control and used representative actual compressor part load performance curves.
Condenser Specific Efficiency
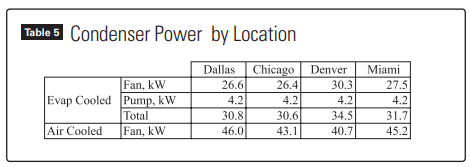
Both evap and air cooled condensers are available with a very wide range of fan power for a given capacity. In a given cabinet size, for example, evap condensers are available with fan motors ranging from 10 hp (7.5 kW) to 40 hp (30 kW). Historically, air cooled condensers had an even larger range, going from 2 hp (1.5 kW) to 10 hp (7.5 kW) for the same size fan on certain belt drive condensers. Today, air cooled condensers tend to utilize direct drive motors and have smaller motors, but still with a substantial range in power for a give capacity. Specific efficiency is the term used to define condenser fan power vs. capacity. Specific efficiency is the heat rejection capacity at an assumed specific efficiency rating point divided by the input power for the condenser fans and, for evap condensers, the spray pump. Specific efficiency rating conditions are unrelated to the application conditions. The rating conditions for evap cooled condensers and air cooled condensers are necessarily different, since one is based on WBT and one is based on DBT. For the same reason, numerical comparison of specific efficiencies can only be made between like condensers, not between air and evap cooled condensers. Table 4 shows the rating assumptions and assumed specific efficiencies used in this study.
The condenser specific efficiency rating conditions are taken from the values used by California utility incentive programs, where this parameter first came into use, as well as more recently in the California Title 24 Standards3,4. Note that nothing is particularly special about the rating points; other rating point assumptions could evolve in the future, which would result in different specific efficiency numbers for each condenser as well as for minimum standards. The 275 BTUh/W value assumed for this study is lower (e.g. higher fan horsepower) than the values required by the 2013 California Title 24 Standard of 350 BTUh/W. The California value was determined to be cost effective for California climates, utility rates and programmatic assumptions, and only for new refrigerated warehouses. The value of 275 BTUh/W is the efficiency estimated by the author that would generally be cost effective on a national basis for a refrigerated warehouse.
It is also important to note that the cost-effective specific efficiency assumptions are based on a design with all condenser fans running in unison and using variable speed fan control, as will be discussed below. An alternative design approach could utilize physically larger condensers with smaller fan motors, in order to obviate the need for variable speed drives, albeit at higher capital cost. With this alternate design approach, the condensers would have a much higher specific efficiency.
Air cooled condenser specific efficiency is based on motor sizes that are currently available from manufacturers, either as standard or with nominal adaptation to standard products. A specific efficiency of 90 BTUh/W was used for the study. Products choices are limited, naturally, since there is not a significant U.S. market for air cooled ammonia condensers. The currently available equipment has a large range of specific efficiencies, with some models substantially higher than 90 BTUh/W.
No adjustments were made to the specific efficiency assumption for altitude. In the case of the Denver location, certainly, the air cooled condenser size would need adjustment for altitude. Air cooled condenser manufacturers publish capacity adjustments for altitude, but no information on motor power at altitude. The typical air cooled capacity adjustment for 5,000 ft (1,500 m) altitude is approximately 12%; which is roughly similar to the air density change from sea level. Since fan power and density are nominally proportional (i.e. based on Affinity Laws) it was assumed that the same specific efficiency basis was reasonable at higher altitude.
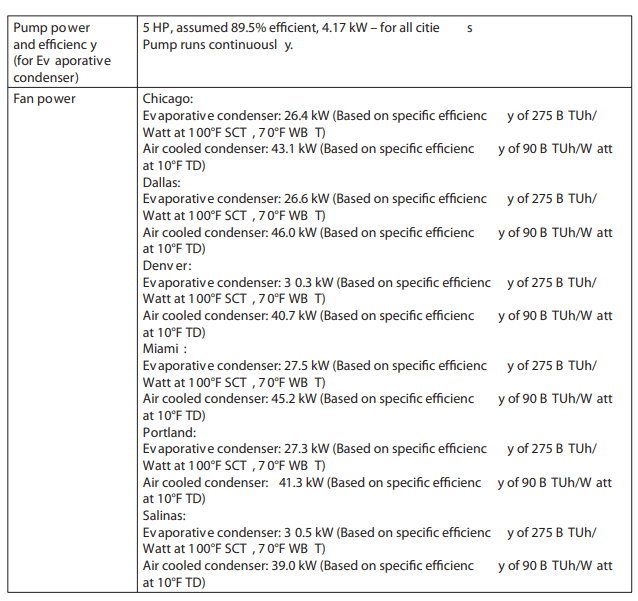
As noted previously air cooled specific efficiencies and evap cooled specific efficiencies cannot be directly compared. Air cooled condensers require far greater air volume than evap condensers and thus generally have higher fan power. Table 5 shows the input power for evap cooled and air cooled condensers for the six study locations.
Hourly Modeling
Building and system modeling was performed using the DOE2.2R simulation program5. This program includes hourly calculation of loads, refrigeration system performance and utility costs. The heat load calculations include transmission with consideration of hourly weather and solar effects; infiltration which utilizes ASHRAE formulas for inter-zonal (doorway) mass exchange, and considers wind velocity; and internal loads which may be automatically calculated (e.g. evaporator fan speed and thus power and heat) or scheduled as part of input instructions (e.g. product and defrost loads). The refrigeration system portion of the program is mass-flow based and calculated at a component level. Refrigerant mass flow is determined from the cooling loads, with compressor operation developed to meet the required mass flow, and based on balance with the available condenser capacity and ambient conditions. Compressor performance is determined from regressions based on saturated suction temperature (SST) and saturated discharge temperature (SDT), with a separate relationship for part load (e.g. slide valve) efficiency. Control strategies for evaporator fans, supervisory compressor sequencing and part load control, and condenser setpoint and fan control are all explicitly modeled (within the limits of an hourly simulation model) in a manner consistent with actual control operation. TMY3 weather files were used for hourly ambient temperatures, solar values and wind velocity.
Adjustments to catalog ratings, primarily equipment de-rating, are essential to effective modeling and in particular to refrigeration modeling and this study for several reasons, including:
- Equipment catalog ratings are based on steady state operation, for new equipment and generally at design (peak) conditions, whereas most hours of operation are not at steady state and the system is operating at off-design conditions (which may not be within the catalog ratings) and at part load.
- Condenser performance values in catalogs have historically not referenced a rating standard and the ratings are not certified. This has changed recently with some evap condenser manufacturers now or soon using CTI standards6 and/or ASHRAE standards7 for testing of evaporative condensers and moving towards future certification of their evap condenser ratings. Manufacturers of air cooled refrigeration condensers in the U.S. have not referenced rating standards in their catalog ratings. The AHRI standard for air cooled condensers, ASNI/ AHRI Standard 4607, uses test rating conditions which are more suitable for air conditioning applications than refrigeration, e.g. 30°F (17°K) approach. Beyond considerations of actual vs. catalog performance at full capacity, factors for performance at part load are less certain and in most cases are not published and given the many variables, would be very difficult to test.
- Transient operation, e.g. fan cycling and cyclical pressure variations may have a large effect on condenser operation.
- Field effects including multiple adjacent condensers, building configuration and effect of prevailing wind, result in recirculation of air from the condenser outlet and reduced condenser capacity. Piping pressure drop and flow imbalance would be part of this factor.
- Scale, corrosion and bio-fouling in evaporative condensers often comprise a large factor, reducing condenser capacity and sometimes condenser longevity.
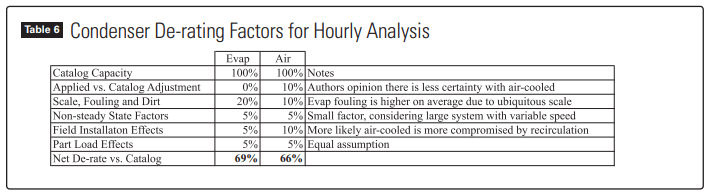
To address all of these factors, derating of the catalog capacity values is necessary to simulate real-world condenser performance at average hourly conditions. Individual factors, largely based on the author’s judgment and opinion, were estimated and summarized in Table 6.
These de-rating factors undoubtedly seem high at first glance; indicating the realized average capacity is approximately a third less than the catalog ratings. Based on the author’s experience in evaluating expected vs. actual hourly performance at a limited number of facilities this is not an unreasonable conclusion, particularly noting the purpose of these factors is to develop an accurate hourly simulation through the course of the year, inclusive of off-design and part load effects, and not just at peak design conditions. Specific de-rating components may be more or less manageable though system design and ongoing system maintenance; for example, a relatively small amount of scale on evaporative condensers can have a very large effect on capacity. Each de-rating component could be subject to a more detailed consideration and study. In terms of this paper, the important issue is whether the various de-rating components for evaporative condensers and air cooled condensers are likely to cause a difference in performance of one vs. the other. There is little difference in the net de-rating factors shown above, thus no large comparative effect on modeling assumptions.
Water usage was estimated using the actual hourly heat of rejection from the simulation model and assuming the industry guideline for evaporation of 2 GPM per 1,000 MBTUh. It’s useful to see how this simply equates to the evaporation of water: 2 Gallons per Minute X 8.34 Pounds per Gallon X 60 Minutes/ Hour X 1,000 BTUs per pound of water equals 1,000,800 BTUh, or 1,000 MBTUh. In addition, bleed rate and drift were estimated and were approximately equal to the hourly evaporation rate. Water treatment cost was included at $750 per month.
Head Pressure Control
Control of head pressure or condensing temperature, which are essentially interchangeable terms in this context, is the essential consideration in comparing evap cooled and air cooled condensers. Without a balanced and consistent assumption the results would be skewed. Head pressure control elements include how condenser fans are controlled (cycling or speed modulation), the control strategies used to control fans, and how low head pressure is allowed to drop, as cooler weather permits.
Floating Head Pressure
Aside from the relatively few hours (if any) in a year that the compressors and condensers run near their maximum capacity, there is a constant opportunity to employ controls to optimize the total power used by the compressors and condenser fans. For lack of a better description, this is called floating head pressure. Floating head pressure is somewhat vague and can have multiple meanings but here it is used for the overall effort to control to the lowest total energy use of compressors and condensers throughout the year. There are three elements:
- How low can the head pressure (or condensing temperature) go, weather permitting?
- How are the condenser fans controlled?
- How is the condenser fan control setpoint determined?
Minimum Condensing Temperature
The lowest possible steady state condensing temperature is a function of compressor oil separator sizing and other compressor limitations, and system design pertaining to liquid supply to evaporators. Generally all modern systems can operate to 70°F (21°C) SCT or lower, i.e. 114 psig (7.9 Bar) for ammonia. Some existing systems have a need for higher pressure during defrost periods, however newer systems typically need no more than 95 psig (6.6 Bar) for defrosting and are equipped with regulators to limit defrost pressure, thereby allowing head pressure reduction to near 95 psig (6.6 Bar) pressure with no effect on defrost.
The value of a minimum condensing temperature lower than 70°F (21°C) may be small a warm climate but could yield large incremental savings in a colder climate. This also becomes an important difference between evap and air cooled systems in many climates. As noted previously evap condensers “lose” capacity as the wet bulb temperature drops, in terms of the approach the condenser can achieve for a given heat rejection, whereas an air cooled condenser maintains the same approach temperature at lower dry bulb temperatures. Coupled with this fact, the difference between DBT and WBT varies through the day and the year in a manner that favors evap cooled condensers in the hottest weather periods but favors air cooled condensers during the moderate and cool temperatures that typically comprise most of the year.
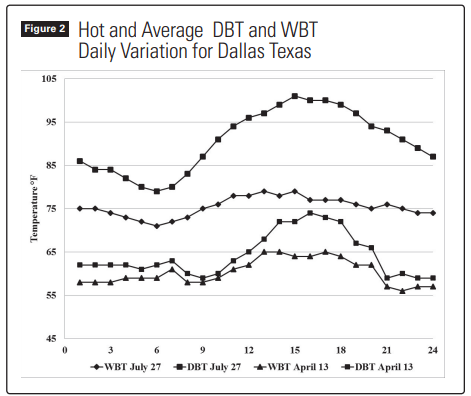
Figure 2 shows the daily temperatures for a hot day and an average day for Dallas, Texas.
Note the much larger difference between DBT and WBT on a hot day than on an average day; here a 33°F (18°K) difference on a hot day and a 10°F (6°K) difference on a cool day.
The relationship between dry bulb and wet bulb temperatures can also be seen by comparing the maximum, average and minimum dry bulb and wet bulb temperatures and the difference, which indicates the nominal advantage of evap cooled condensing. Table 7 shows weather statistics for Dallas, Texas, taken from the TMY3 weather file. Note that the maximum WBT does not coincide with the maximum DBT, which is typical for most if not all climates. The WBT that coincides with the peak DBT results in a 27°F (15°K) difference, compared with the average difference between DBT and WBT being approximately 8°F (4°K).
Figure 5 shows the dry bulb temperature for each hour of the year, arranged from hottest to coldest, with the coincident wet bulb temperatures, showing the greatest difference between DBT and WBT during peak temperatures and a declining difference in moderate and cold weather.
Added to these “facts of weather,” it is also useful to consider the characteristic increase in approach at lower WBTs observed with evap cooled condensers vs. the fixed approach with air cooled condensers. If condensing temperature is reduced along with ambient temperature, the difference between DBT and WBT gets smaller, and at the same time the difference between air cooled and evap cooled condenser approach gets larger. Thus, air cooled condensing should have greater advantage the lower head pressure is allowed to float.
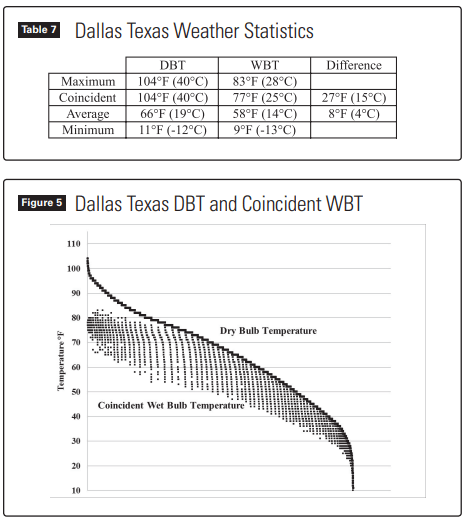
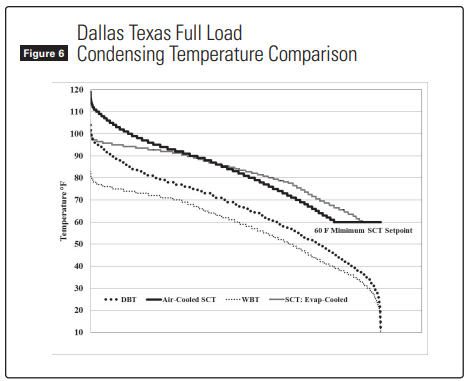
Figure 6 shows DBT, coincident WBT (using a regression to smooth the hourly values) and the respective condensing temperatures, assuming system operation at full load for the purpose of this figure.
The minimum condensing temperature used in this study for all six locations was 60°F (15.6°C).
Fan Control
For both evap and air cooled condensers the study assumes all fans are controlled in unison with variable speed, rather than fan cycling. The use of all surface, all of the time, is generally the most efficient means of condenser capacity utilization. The affinity laws define physical principles of flow, pressure drop and power and specifically the “third power” relationship between airflow and fan power. This relationship is shown as the curve in Figure 7 and is applied to compare a condenser with fan cycling to the same condenser with variable speed fan control, with both condensers at 50% capacity. Condenser capacity is nominally proportional to airflow and fan speed whereas power varies with the cube of fan speed, thus increasing the part load condenser efficiency at 50% capacity from 90 to 360 BTUh/W.
The nonlinear relationship of fan power to airflow, and thus to condensing temperature and compressor power is important, and inherently points to an important aspect of control optimization as described below.
Setpoint Determination
The final aspect of condenser control and optimizing system energy is setpoint determination. The essential objective is balancing the compressor and condenser power to obtain the lowest total power. From only the perspective of reducing compressor power, the condenser would simply run at 100% capacity to balance at the lowest head pressure possible at the ambient temperature. Or course, the condenser uses energy as well, which creates the tradeoff between compressor power and condenser power. As shown previously, fan power vs. condenser capacity is non-linear, following a third power relationship. In addition, like all heat exchangers, increased condensing capacity has diminishing return in terms of the heat exchanger approach. For example, if doubling condenser capacity (and power) reduces the approach (TD) by 20°F to 10°F (11.1°K to 5.6°K), a reduction of 10°F (5.6°C) in condensing temperature, an additional doubling would only reduce the approach and condensing temperature by 5°F (2.8°C), producing only half the benefit at the compressor. Both of these non-linear relationships complicate the goal of balancing condenser fan control vs. compressor power. Simply put, the goal is to use as much condenser capacity as possible, without increasing condenser power more than the gain achieved in compressor power.
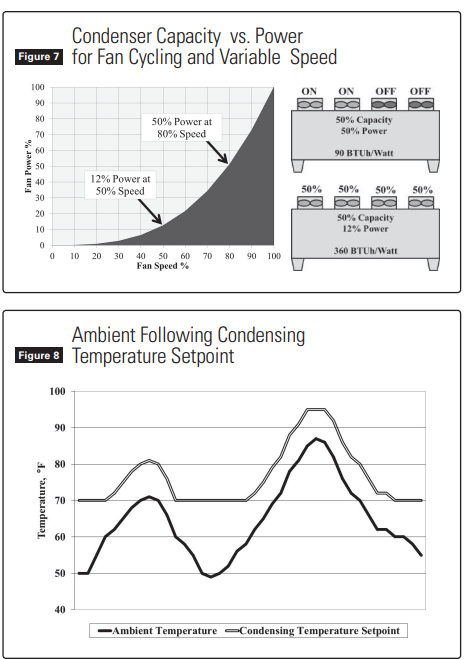
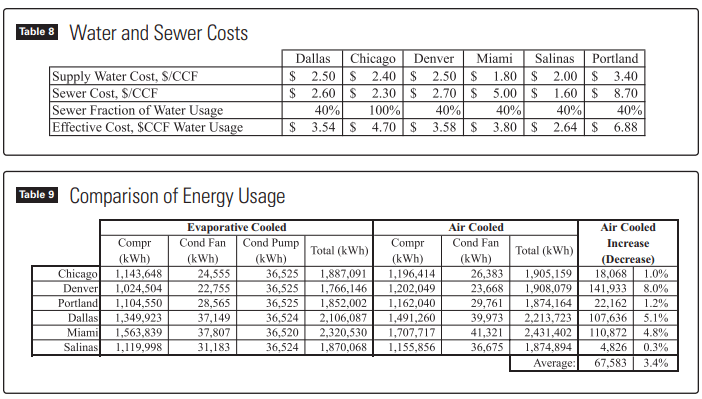
The most common control strategy used to control floating head pressure for optimum power use is ambient-following logic, where the condenser control setpoint is determined by adding an “offset” value to the current ambient temperature to determine the target saturated condensing temperature setpoint. This offset is typically called the control TD. For evap cooled condensers, WBT is used and for air cooled condensers DBT is used. A simplified example of ambient following control is shown in Figure 8. The condensing temperature setpoint follows ambient temperature, bounded by a minimum setpoint limit defined by the system design minimum pressure capability (e.g. of 70°F (21.1°C) in this example figure) and typically a maximum setpoint limit as well (e.g. of 95°F (35.0°C)) at which it is desirable for the fans to run at 100% to limit maximum system pressures, regardless of energy optimization.
When using an energy simulation, as was employed for this study, the optimum control TD value is determined by iterating the simulation control TD value to obtain the lowest total combined power. To allow for real-world control variations, the control TD is then raised slightly. In actual plant operations, typically lacking detailed guidance from energy analysis, the control TD setpoint is commonly optimized using a condenser fan speed “sweet spot” of 60-80% target, when not at minimum SCT.
An average speed of 60-80% is normally close to the ideal operating point; utilizing a large fraction of the condenser capacity and still providing a sizable reduction in condenser fan power.
Other control and optimization methods are feasible, but ambient following is the most common method and for the purpose of this study, creates a relatively balanced and consistent comparison between evap cooled and air cooled condensing.
WATER COSTS
Water, sewer and water treatment costs are generally the impetus for considering air cooled condensing, in addition to concern regarding future water availability. For each city in this study the water and sewer rates were investigated, with the results shown in the Table 8.
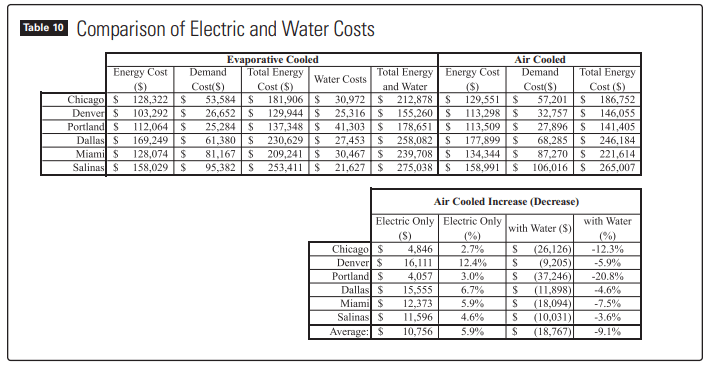
For cities that adjust the sewer rate based on measured flow or submetering credits to account for water that is evaporated, the sewer cost was factored to 40% of the supply water cost, and the two added to obtain the effective cost of both supply water and sewer costs is expressed in $/CCF (hundred cubic feet) of supply water consumption.
RESULTS
Simulation results for the six cities are shown in Table 9 and Table 10.
Energy Usage
Table 9 shows the energy usage for compressors and condensers, as well as the total simulation energy for the facility which includes the balance of the loads in the simulation, specifically evaporator coil fans and lighting in refrigerated spaces.
In all locations, air cooled condensing uses more total energy (kWh) than evaporative cooled condensing, ranging from almost no difference to an 8% increase in Denver, which is a very dry climate obviously attractive for evaporative cooling. The evaporative condensing advantage in Miami, which has a very high humidity and thus relatively little difference between DBT and WBT is interesting and points out to the closer approach achieved by evaporative condensers at higher wet bulb temperatures.
Operating Costs
Table 10 shows the electric utility cost and water costs for each location. Water costs are based on Table 8 plus water treatment costs which were estimated at $750 per month for all locations. The electric costs are separated between energy cost (kWh usage) and demand charges.
The effect of high demand charges for air cooled condensing is apparent and is due to the air cooled condenser response to DBT and the fact high DBT temperatures coincide with utility summer on peak demand charges.
Electric costs increased in all cities, from 3% to 12%, with the highest being Denver. The average cost increase is approximately 6% and on the order of $1,000 per month, so in the context of other system design variables and associated operating cost differences, this is not a large penalty. With water costs savings, the annual cost decreases for all locations. The net savings with both electric and water costs considered ranges from 4% to 20%, with dollar savings from approximately $9,000 to $37,000. The highest savings, for Portland, is largely due to the water costs in Portland; nearly double the average of the other locations, with most of this cost difference due to high sewer rates.
Note that the simulation did not include any form of cooling load shifting control for either evap cooled or air cooled systems. Load shifting on high efficiency systems should be undertaken cautiously to avoid increasing total energy usage, but to the extent load shifting is cost effective in all other respects, it would yield greater benefits on air cooled systems than on evap cooled systems, due to the higher day-to- night range in dry bulb temperatures than wet bulb temperatures, particularly in peak periods. The assumptions described in this paper, naturally, impact the results.
The assumptions were intended to accurately assess both condensing options with the control methods (related to condensers) that would be employed in a modern facility. The sensitivity of various assumptions was not investigated. Most assumptions likely have a small comparative difference, whereas others (e.g. minimum condensing temperature setpoint) would be expected to have a large comparative difference.
Also, the condenser de-rating assumptions were definitely substantial and either through error in these assumptions, or actions taken to minimize the factors in a particular design or application, the comparative outcome in energy usage could be materially different. There is also a learning curve that could be expected in applying large air cooled ammonia condensers (e.g. field effects), although the ammonia plants on most refrigerated warehouses are moderately sized and not significantly beyond the scale experienced with other air cooled refrigeration and chiller applications.
Water consumption used in the study may be somewhat overstated for a facility with excellent water conditions and/or very well managed water treatment. However, in the author’s opinion, the water consumption assumptions are likely to understate the average refrigerated warehouse system, since water usage to condensers is often not metered and rarely managed vs. expected usage for the actual heat rejection. Of course, this is an opportunity for improvement that can be addressed aside from the comparison of air cooled and evaporative condensing.
Capital Cost and Payback
The additional cost for air cooled condensing includes:
- Air cooled condenser cost premium over evaporative condensers
- Cost of increased design pressures for vessels and piping
- Increased compressor motor cost for higher peak operating pressures
- Additional condenser piping
- Structural support for condensers (potentially lighter weight but larger area)
Detailed equipment selection and installation pricing was not undertaken as part of this paper, since costs vary greatly based on design conditions and site-specific factors. Based on high level estimates by the author, the added capital cost for air cooled condensing on the subject facility is estimated between $200,000 and $300,000, which would equate to a payback of 10 to 30 years. Payback in this range would typically not encourage use of air cooled systems solely on the basis of energy savings, but would help support an air cooled choice if other factors such as water conditions and availability present challenges. In some areas, evaporative condenser life is shortened by difficult water conditions. For these facilities, a life cycle analysis would reflect the value of air cooled condensers which (if properly designed) would have a longer life.
High side design pressure requirement may be a significant cost determinant. In certain areas with low design dry bulb temperatures, the design pressure requirements may be within the current standard practice for evap cooled systems, thus causing no additional high side costs other than the condenser and structural cost difference.
CONCLUSIONS
The use of air cooled condensers for ammonia systems is potentially attractive. Energy cost is greater in all areas evaluated, but when water costs are considered, the net operating cost is lower in all six U.S. locations considered in this paper, which utilized hourly simulation of air cooled and evaporative cooled condensing in a representative refrigerated warehouse.
Energy usage for air cooled condensers over evap cooled condensers ranged from almost no increase to an 8% increase in Denver, Colorado. Electric cost increase ranged from approximately 3% to 12%. With water cost included, cost reduction ranged from 4% to 21%, with the savings from greatest to least in the following order: Portland, Oregon; Chicago, Illinois; Miami, Florida; Dallas, Texas; Salinas, California; and Denver, Colorado.
Higher electric operating costs with air cooled condensing reflect the higher electric rates concurrent with high dry bulb temperatures, when the comparative advantage of evaporative condensing is greatest. No refrigeration load shifting was included in the analysis, and may comprise a potential advantage for air cooled condensing due to the higher daily range of dry bulb temperature compared with wet bulb temperature.
Water usage was calculated based on heat rejection from the hourly simulation and typical water bleed rates. Actual water usage may be lower or could be substantially higher if not carefully controlled. The study results are dependent on control assumptions, in particular the use of variable speed control of all fans in unison and ambient-following control.
Given the wide range of water costs, utility rates (and rate shapes in peak periods), site specific analysis may often be necessary to accurately identify operating costs of evap cooled and air cooled condenser options. For both air cooled and evap cooled condensers, the catalog capacity ratings were de-rated by more than 30% to develop the average capacities for the hourly simulation. This is a significant assumption for which there is limited field testing. Future work is required for both evap cooled and air cooled condensers to evaluate installed average performance in order to achieve more accurate annualized analysis, as well as establish performance expectations.
REFERENCES
- ANSI/ASHRAE/IESNA Standard 90.1-2007 ANSI/ASHRAE/IESNA Standard 90.1-2007 Energy Standard for Buildings Except Low-Rise Residential Buildings.
- Baltimore Aircoil Company, Product and Application Handbook Volume IV-2012.
- California Building Standards Code (Title 24, California Code of Regulations) 2008 Building Energy Efficiency Standards for Residential and Nonresidential Buildings.
- California Building Standards Code (Title 24, California Code of Regulations) 2013 Building Energy Efficiency Standards for Residential and Nonresidential Buildings.
- DOE2.2R Building Simulation Program (Refrigeration Version DOE-2.2-R50o), James J. Hirsch, Camarillo, California www.doe2.com.
- Cooling Technology Institute (CTI) 106-ATC (04)–Acceptance Test Code for Mechanical Draft Evaporative Vapor Condensers.
- ANSI/ASHRAE Standard 64-2005 – Methods of Laboratory Testing Remote MechanicalDraft Evaporative Refrigerant Condensers. 8 ASNI/AHRI Standard 460-2005 – Performance Rating of Remote Mechanical-Draft Air cooled Refrigerant Condensers.
APPENDIX I – SIMULATION ASSUMPTIONS