


Case History: A Study of Incidents in the Ammonia Refrigeration Industry
Peter R. Jordan, Senior Principle Engineer, MBD Risk Management Services, Inc.
ABSTRACT
In June of 2005, the author initiated a project to collect data related to ammonia incidents using information from publicly available sources. For the past 14 years, the data have been input into an Excel spreadsheet every day. This information was analyzed and compared with historical incident data available from the U.S. Environmental Protection Agency’s Risk Management Plan database and a 2008 IIAR survey. The hope is that analyzing these incidents will highlight industry policies and practices that can prevent and/or mitigate the consequences of future incidents in the ammonia refrigeration industry, thereby improving overall industry safety.
ACKNOWLEDGEMENT
The success of the 42nd Annual Meeting of the International Institute of Ammonia Refrigeration is due to the quality of the technical papers in this volume and the labor of its authors. IIAR expresses its deep appreciation to the authors, reviewers and editors for their contributions to the ammonia refrigeration industry.
ABOUT THIS VOLUME
IIAR Technical Papers are subjected to rigorous technical peer review. The views expressed in the papers in this volume are those of the authors, not the International Institute of Ammonia Refrigeration. They are not official positions of the Institute and are not officially endorsed.
International Institute of Ammonia Refrigeration 1001 North Fairfax Street, Suite 503
Alexandria, VA 22314
+ 1-703-312-4200 (voice) + 1-703-312-0065 (fax)
www.iiar.org
2020 Natural Refrigeration Conference & Heavy Equipment Expo
Orlando, Florida
Introduction
The Occupational Safety and Health Administration (OSHA) published the Process Safety Management (PSM) standard, 29 CFR 1910.119, as a Final Rule on February 24, 1992. The U.S. Environmental Protection Agency (EPA) issued the Risk Management Program (RMP), 40 CFR Part 68, as a Final Rule on January 31, 1994. The purpose of these regulations is to prevent accidental releases of chemicals that could pose a threat to human health and the environment.IIAR members have struggled to answer some basic industry-related questions since the earliest days of the PSM standard and the RMP rule. For example,
- How many incidents occur in the ammonia refrigeration industry?
- What are the consequences of these incidents?
- What are the most common causes of the incidents?
- What can be done to prevent and/or minimize the consequences of these incidents?
This paper focuses on the efforts made to answer these questions.
EPA RMP Database
In 2004, IIAR formed an Ammonia Release Task Force. The mission of the task force was to collect and compile information on all ammonia releases throughout the industry (IIAR 2004). The data collected would be used to identify the areas of greatest need for attention to help the industry reduce the number of releases.
One of the first actions this task force accomplished was to collaborate with the U.S. Chemical Safety and Hazard Investigation Board (CSB) to review five-year accident history data contained in EPA’s RMP database. Facilities are required to report accidental releases from covered processes that have significant onsite or off-site impacts in the five-year accident history section (Section 6) of the RMPs submitted to the EPA. Significant on-site and off-site impacts are defined as accidental releases that result in on-site deaths, injuries, or significant property damage; or known off-site deaths, injuries, evacuations, sheltering in place, property damage, or environmental damage.
CSB provided the IIAR Ammonia Release Task Force a spreadsheet that included more than 600 ammonia refrigeration incidents contained in RMPs submitted between 1994 and 2004 (CSB 2004). Based on analysis of these incidents, the task force came to the following conclusions:
-
- The following industry sectors had the most incidents reported in the fiveyear accident history database:
- Red meat and poultry processing facilities,
- Cold storage facilities,
- Frozen food facilities, and
- Dairies and related facilities.
- Facilities may have been unsure of the five-year accident history requirements and may thus have overreported ammonia incidents to the EPA. Almost half of the five-year incidents reported to the EPA during this period had no on-site or off-site impacts listed in Section 6.9 (OnSite Impacts) or Section 6.10 (Known Off-Site Impacts) of their RMP submissions. If an incident had no on-site or off-site impacts, it should not have been reported in the five-year accident history.
- Approximately half of the releases were reported to be from valves and piping.
- Approximately half of the reported incidents were related to equipment failure and approximately half were related to human error. Contributing factors related to equipment failure included overpressure scenarios, process design failures, and unsuitable equipment. Contributing factors related to human error were maintenance activities, improper procedures, and management error.
- The following industry sectors had the most incidents reported in the fiveyear accident history database:
The information provided by EPA and CSB proved valuable, but it was only a first step. Based on a review of RMP five-year accident histories, ammonia incidents were clearly occurring, but the root causes of these incidents were not immediately identifiable. The task force felt that additional work was needed.
IIAR Industry Section Meeting
The next step taken by IIAR’s Ammonia Release Task Force was to obtain ammonia incident data directly from industry representatives. In June of 2006, the task force set up a meeting in Arkansas with representatives from five companies in the poultry processing sector. During this meeting, the following ground rules were established:
- All participating companies were to benefit from this meeting because the goal was to identify industry-specific recommendations designed to reduce the number of ammonia incidents occurring at industrial ammonia refrigeration facilities.
- No information was to be documented that would identify the company associated with any ammonia incident.
- No marketing was to occur in Arkansas; the task force had nothing to “sell” except safety.
- The poultry processing sector was to be the first of at least five industry sector meetings to be conducted.
The hope was that the meeting participants would be free to discuss actual incidents that occurred at their facilities. Specifically, the task force would attempt to determine the following information:
- What were the root causes of these ammonia incidents?
- What were the consequences of these ammonia incidents?
- What recommendations were made/can be made to prevent future incidents?
IIAR’s Ammonia Release Task Force assumed that industry representatives would be willing to discuss ammonia incidents at their facilities openly provided that the incident information was de-identified. Five ammonia incidents were discussed with five poultry processers during the initial meeting, in which the task force promised neither to take notes nor to release the results of these discussions due to the sensitive nature of the incident data. However, because no information was recorded or analyzed, the main goals of the meeting were not accomplished. After additional attempts to overcome this shortcoming, the task force abandoned the idea of obtaining ammonia incident data during industry sector meetings, recognizing that any data obtained during these meetings was too sensitive to be released to the industry at large.
IIAR Ammonia Incident Survey
In May of 2008, IIAR tried a different approach to collecting ammonia incident data, sending a questionnaire to all IIAR members. The stated intention of the questionnaire was to obtain ammonia incident information to assist IIAR members in the proper and safe handling of ammonia as a refrigerant. Also noted on the questionnaire was that all collected information would remain anonymous.
The questionnaire included the following 12 questions (IIAR 2008):
- What organization does your facility belong to?
- What region is your facility located?
- Which category does your facility fall under? More than 10,000 pounds of ammonia? Less than 10,000 pounds of ammonia?
- Which of the following best describes your facility (i.e. Cold Storage Facility, Dairy Facility, Frozen Food Production, etc.)?
- Based on your experience, where in the system do most of the ammonia releases occur?
- What are the areas where most ammonia releases occur (not included in question #5)?
- Based on your experience, what are the most common causes of ammonia releases?
- What are the most common causes of ammonia releases (not included in question #7)?
- During the past five years, how many ammonia releases amounting to at least 100 pounds has your facility experienced?
- What type of response resulted from the ammonia releases?
- What factors most commonly lead to ammonia releases?
- Which areas should the IIAR focus on?
IIAR summarized the ammonia incident survey results in October 2009. More than 500 facilities in the ammonia refrigeration industry provided ammonia incident information. Approximately 80% of the responses came from facilities housing more than 10,000 lb of ammonia and thus most likely subject to OSHA’s PSM Standard and EPA’s RMP Rule. More than 20% of the responses were from facilities storing less than 10,000 lb of ammonia and thus were most likely subject to OSHA and EPA General Duty Clauses. The greatest number of responses came from cold storage facilities (33%), frozen food production facilities (16%), and meat processing facilities (11%).
Figure 1 shows that more than two-thirds of the facilities responding to the survey had no ammonia releases of at least 100 lb during the five years preceding the survey. Thirty-one facilities (6%) had three or more releases of at least 100 lb during this same period, and nine facilities reported that they had experienced 10 or more incidents during the preceding five years in which more than 100 lb of ammonia was released.
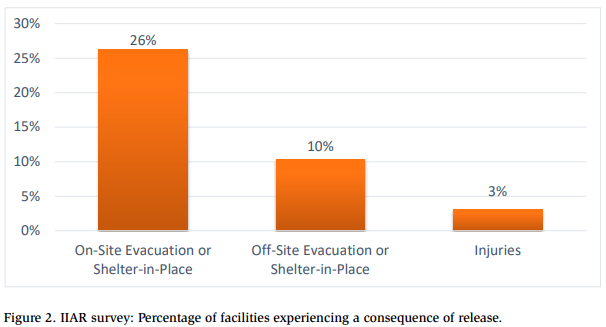
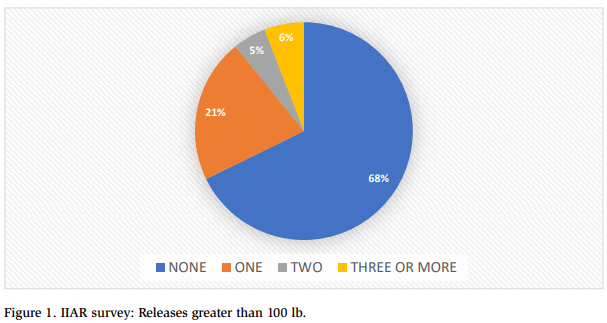 Figure 2 summarizes the consequences of the releases reported in the IIAR survey. Facilities were evacuated in approximately one-quarter of the releases, and off-site consequences occurred in 10% of the releases. Only 3% of the releases resulted in injuries.
Questionnaire respondents indicated that equipment failure caused approximately 60% of the reported incidents. The top five reported causes of equipment failure related to
- Leaks from mechanical seals,
- Corrosion,
- Relief valve opening prematurely
- Hydraulic to thermal shock, and
- Failure of safety cutout.
Questionnaire respondents reported that human error caused 37% of the incidents. The top five reported causes of human error related to
- Improper training,
- Improper maintenance procedures,
- Oil draining procedures,
- Line opening procedures, and
- Improper valve opened or closed.
Ammonia Incident Database
To discover the root causes of the incidents described in RMPs submitted between 1994 and 2004, an effort was begun in June of 2005 to collect in an Excel spreadsheet the ammonia incident data reported via publicly available sources. The vast majority of the information contained in this “Ammonia Incident Database” was obtained via Google Alerts. Google Alerts is a content-change detection and notification service offered by the search engine company Google. The service sends emails to users when it finds new results—such as web pages, newspaper articles, blogs, or scientific research—that match a user’s search term (Wikipedia 2019). The search term used to generate the Ammonia Incident Database was “ammonia.”
Additional information in the Ammonia Incident Database was obtained from incident reports posted on the Chemical Safety Board’s website. A conscious decision was made not to supplement the Ammonia Incident Database with information obtained from any other source, including first-hand knowledge of any incident, to enable analysis of “raw” data obtained from consistent sources.
Each day, the publicly reported ammonia incidents were reviewed and entered into the Ammonia Incident Database along with the following information:
- . Source of the information;
- Date and time of the incident;
- Company involved, including location;
- Amount of ammonia released;
- Release duration;
- Off-site response personnel involvement;
- Consequences of the release;
- Release location; and
- Cause of the release
When preparing this technical paper, the Ammonia Incident Database was modified by restricting incidents included in the database to those that occurred in the United States and Canada. Incident data from other countries was excluded for two reasons. First, U.S. and Canadian incident data came from a wide range of events and included incidents that resulted in relatively minor consequences. Incident data from other countries tended to include only reports of incidents with catastrophic consequences. Second, the database compiler had extensive knowledge and understanding of the practices followed at facilities operating ammonia refrigeration systems in the United States and Canada, but limited experiences regarding the practices followed in the rest of the world.
The goal of the Ammonia Incident Database is to compile details regarding contemporary events, analyze that data, and compare the results with historical incident data in an attempt to answer the following questions:
- Have the number of incidents increased or decreased?
- What were the consequences of the incidents?
- In what daypart did the incidents occur?
- Which industry sectors were responsible for the incidents?
- In which geographic regions did the incidents occur?
- Where in the facility did the incidents occur?
- What were the most common causes of the incidents?
- How effective are ammonia mitigation systems?
- What can be learned from incidents resulting in catastrophic consequences?
The remainder of this paper will address these questions.
Analysis of Ammonia Incident Data
An analysis of the of the Ammonia Incident Database indicates that intensive safety efforts are underway in many segments of the refrigeration industry, but also that there’s still a way to with regard to ammonia release prevention programs.
1. Have the Number of Incidents Increased or Decreased?
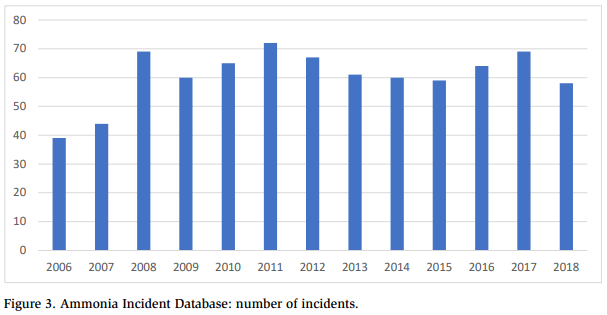
Figure 3 answers the question concerning the changes in incident numbers—a question that always arises when analyzing or developing safety procedures for the industrial ammonia refrigeration industry. Between 2008 and 2018, ammonia incidents per year reported in the Ammonia Incident Database was relatively constant, averaging 64 reported incidents in the United States and Canada per year. Thus, the number of incidents neither increased nor decreased—it remained essentially constant during that time period. 1. Have the Number of Incidents Increased or Decreased? Figure 3 answers the question concerning the changes in incident numbers—a question that always arises when analyzing or developing safety procedures for the industrial ammonia refrigeration industry. Between 2008 and 2018, ammonia incidents per year reported in the Ammonia Incident Database was relatively constant, averaging 64 reported incidents in the United States and Canada per year. Thus, the number of incidents neither icreased non decreased – it renained essentially constaunt during that time period.
2. What Were the Consequences of the Incidents?
Two assumptions were made when determining the consequences of the ammonia incidents:
- No off-site consequences were assumed to have occurred if people were ordered to move simply to improve emergency vehicle access to the site. This is consistent with EPA guidance for the preparation of the RMP’s fiveyear accident history (EPA 2009).
- EPA defines “injuries” for the five-year accident history as any effect that results either from direct exposure to a chemical or from indirect consequences caused by an ignition of a chemical vapor cloud (e.g., a window shattering after an ignition) and that requires medical treatment or hospitalization (EPA 1994). Medical treatment means treatment, other than
first aid, administered by a physician or registered professional personnel under standing orders from a physician (EPA 1994). When analyzing the incident data, all persons taken to a hospital were assumed to have been provided with medical treatment and were thus injured.
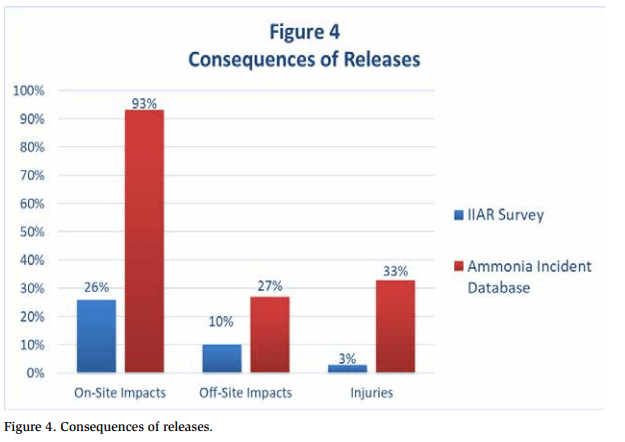
When data obtained via the IIAR survey was compared with data from the Ammonia Incident Database, more on-site and off-site consequences were reported for incidents in the Ammonia Incident Database than were reported in the IIAR survey (see Figure 4). This is not surprising given that incidents reported via publicly available sources were more likely to result in consequences. Approximately 93% of the incidents in the Ammonia Incident Database resulted in on-site consequences vs. 26% in the IIAR survey. Likewise, 33% of the incidents in the database resulted in injuries vs. 3% in the IIAR survey. The incidents recorded in the Ammonia Incident Database from June of 2005 to September of 2019 resulted in more than 1,500 people requiring treatment for exposure to ammonia. Though the majority of injuries were relatively minor, it still averaged to one person in the United States or Canada being treated for ammonia exposure every 2.5 days.
The following additional information was gleaned from the Ammonia Incident Database:
- Off-site responder personnel (e.g., the fire department) responded to virtually all (99%) of the incidents.
- The average duration of each incident was approximately four hours.
- The average amount of ammonia released during each incident was calculated to be 2,900 lb, although the accuracy of this figure is questionable because
- No release amount was reported for the majority of incidents in the database;
- Numerous incident reports identified “small releases” but no quantity, and the event was not included in the calculations; and
- The relatively high estimate was skewed by several large ammonia releases in the database.
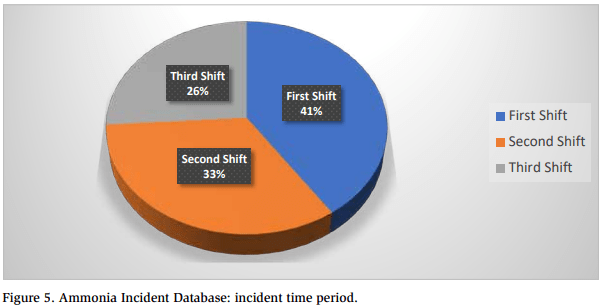
3. In What Daypart Did the Incidents Occur?
The time of day may have affected the timing of ammonia incidents. For example, more ammonia incidents may have occurred during off-shifts because less experienced personnel may have worked during these shifts.
For the purposes of the analysis, each incident was placed into one of three shifts:
- First shift: 8:01 a.m. to 4 p.m.;
- Second shift: 4:01 p.m. to midnight; and
- Third shift: 12:01 a.m. to 8:00 a.m.
Figure 5 shows that almost 75% of the incidents occurred during the first and second shifts, which may reflect that these were the shifts when maintenance and repairs were typically performed. But the bottom line is that incidents occurred during all three shifts.
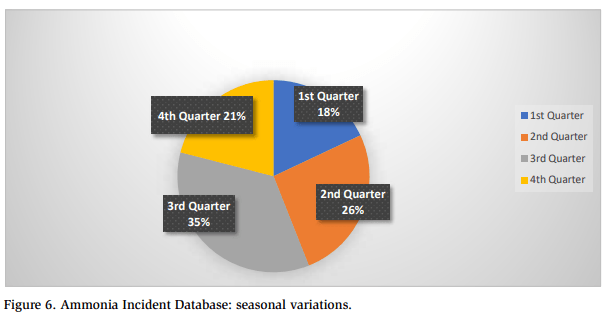
The Ammonia Incident Database was examined to determine whether the ammonia incidents display seasonal variation. Figure 6 shows the breakdown by calendar quarter of incidents that occurred during the time period covered by the database. Approximately 60% of the incidents occurred during warm weather periods (second and third quarters). This may have been due to the seasonal operation of many facilities. For example, vegetable and fruit processing facilities were more likely to be operational during warm weather periods. In addition, warm weather periods were more likely to result in higher system head pressures, which could have led to more releases from pressure relief valves.
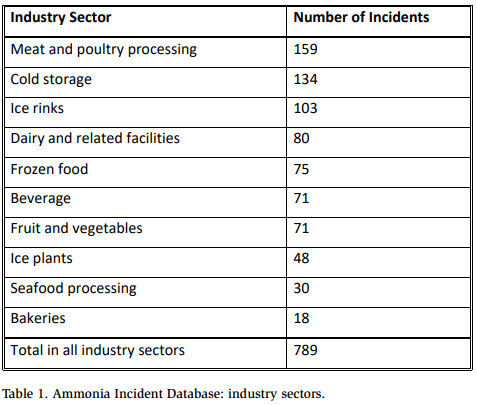
4. Which Industry Sectors Were Responsible for the Incidents?
Table 1 summarizes incidents by industry. Four of the top five industry sectors on this list (meat and poultry processing, cold storage, dairies, and frozen food) were the top four industry sectors in EPA’s RMP five-year accident history database. Three industry sectors at or near the top of the list were not present in EPA’s database: ice rinks, beverage, and fruit and vegetable facilities. These three industry sectors were probably not included in EPA’s database because many of these facilities contained less than 10,000 lb of anhydrous ammonia and/or were located in Canada and thus not subject to EPA’s Risk Management Program.
IIAR survey data indicate that some facilities had more incidents than others. A similar trend was noted in the Ammonia Incident Database. When companies in one industry sector were compared with similarly sized companies in the same industry sector, the number of incidents sometimes varied significantly. For example, Company A in one industry sector had 29 incidents in the database, whereas Company B in the same industry sector had only four incidents.
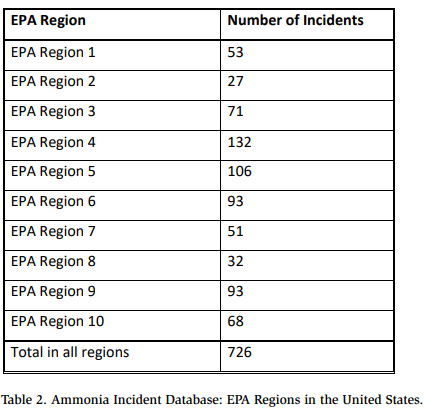
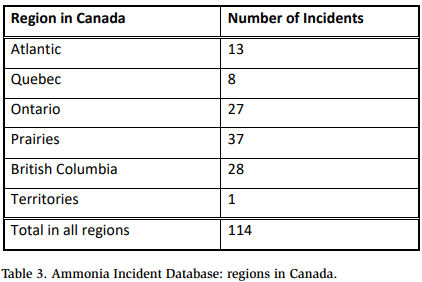
5. In Which Geographic Regions Did the Incidents Occur?
Tables 2 and 3 show the number of incidents in each region in the United States and Canada for the time period June 2005 through September 2019. Regions with higher numbers of incidents, for example, EPA Region 4 (Alabama, Florida, Georgia, Kentucky, Mississippi, North Carolina, South Carolina, and Tennessee) and EPA Region 5 (Illinois, Indiana, Minnesota, Ohio, and Wisconsin), appeared to reflect the total number of meat and poultry processing, cold storage, and dairy facilities located in these regions. The relatively low number of incidents in EPA Region 2 (New York, New Jersey, Puerto Rico, and U.S. Virgin Islands) most likely reflected the relatively small number of facilities operating ammonia refrigeration systems in this region. In Canada, the location of ice rinks appeared to have the greatest effect on the number of incidents occurring in each region.
6. Where Did the Incidents Occur?
Figure 7 shows the location within the facilities where incidents occurred. More incidents occurred in machinery rooms than in production areas (i.e., indoor areas other than the machinery room), probably because of the relatively large concentration of refrigeration equipment in machinery rooms. Approximately half of the incidents occurred outdoors. The majority of the outdoor incidents (~73%) in the Ammonia Incident Database were releases from pressure relief valves, and most of the releases from pressure relief valves resulted in injuries and/or off-site consequences.
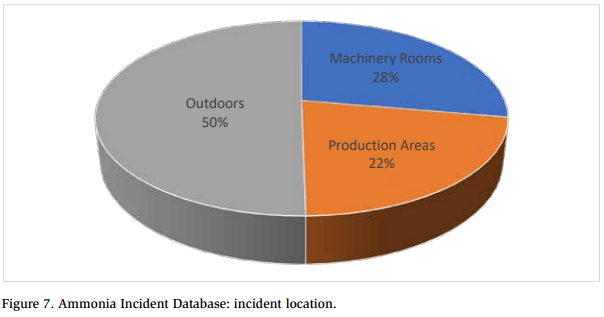
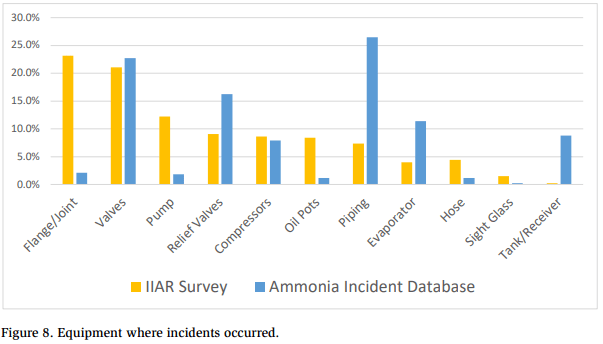
Figure 8 summarizes the equipment where releases occurred as reported in the IIAR survey and the Ammonia Incident Database, which indicate that 60 to 65% of the releases occurred from flanges, joints, valves, and piping. This was consistent with EPA’s RMP database, which reports that approximately half of the releases originated from valves and piping.
7. What Were the Most Common Causes of the Incidents?
Figure 9 shows the breakdown of incidents caused by human error, equipment failure, and external events in EPA’s RMP database, the IIAR survey, and the Ammonia Incident Database. Each database indicates that a similar number of incidents (between 37 and 48%) were due to human r. The biggest discrepancies were in the number of incidents caused by equipment failure (41% in the Ammonia Incident Database vs. 60% in the IIAR survey) and the number of incidents related to external events (15% in the Ammonia Incident Database vs. 1% in the RMP database and 3% in the IIAR survey). Causes of external events included fires, impacts from motorized equipment (such as forklifts), weather-related events, and damage due to structural or building failure.
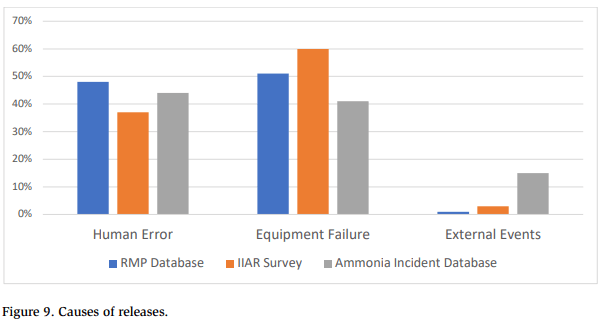
Table 4 summarizes the incident causes recorded in the Ammonia Incident Database. Note that no cause was identified for approximately two-thirds of the incidents. More than one-quarter (27%) of the incidents were related to line-opening operations. The database contained numerous comments referring to “residual ammonia was left in the equipment” and “the release occurred when equipment was opened while performing maintenance.”
When related causes were combined into one group, the largest percentage of incidents (36%) was caused by equipment failures (faulty equipment, leaks from seals/gaskets, corrosion, and faulty pressure relief valves). The second largest group of incidents (33%) was caused by human errors (line opening, liquid transfer, oil draining, and improper valve opening).
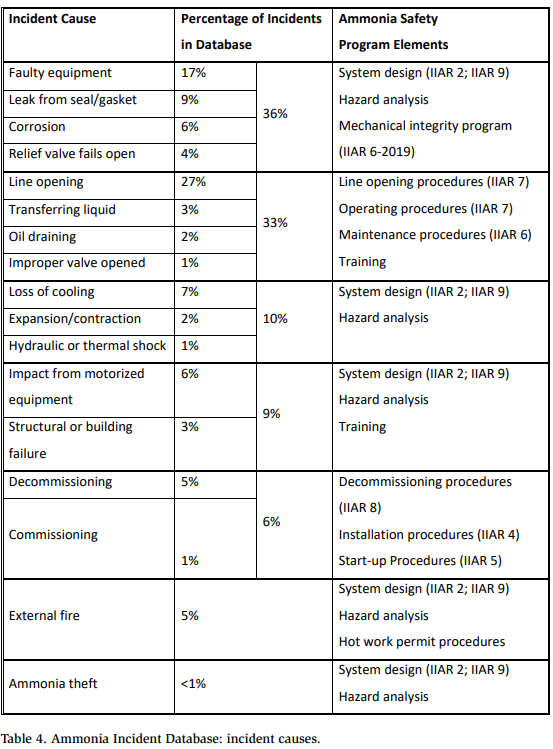
For each group of incident causes, Table 4 lists general ammonia safety program elements that could have been used to prevent these incidents from occurring and/ or minimize the consequences of the incidents. Many of these elements are directly related to current ANSI/IIAR standards.
This technical paper is not the first document to review actual incidents in the ammonia refrigeration industry. In 2001, EPA issued an updated alert on the “Hazards of Ammonia Releases at Ammonia Refrigeration Facilities.” The recommendations included in this alert are strikingly similar to the items contained in the ammonia safety program elements column in Table 4. For example, the EPA alert presents the following recommendations:
- Establish training programs to ensure that knowledgeable personnel operate and maintain the ammonia refrigeration system.
- • Develop and require refrigeration personnel to follow written, standard procedures for maintaining the system, including such routine practices such as oil draining.
- • Provide barriers to protect refrigeration equipment, i.e., lines, valves, and refrigeration coils, from impact areas where forklifts are used.
- Develop and maintain a written preventive maintenance program and schedule based on the manufacturer’s recommendations for all of the refrigeration equipment.
8. How Effective Are Ammonia Mitigation Systems?
Members of the IIAR Standards Committee spend countless hours discussing the design of mitigation systems for an ammonia refrigeration system. To aid in these discussions, the Ammonia Incident Database was reviewed for clues on ammonia mitigation systems.
Overpressure protection devices are crucial to the design of a safe ammonia refrigeration system. As mentioned earlier in this paper, the majority of outdoor releases (~73%) noted in the Ammonia Incident Database were from pressure relief www.iiar.org A Publication of the International Institute of Ammonia Refrigeration | August 2020 | CONDENSER | 65 32 © IIAR 2020 Technical Paper #7 2020 Natural Refrigeration Conference & Heavy Equipment Expo, Orlando, Florida valves. And most of the releases from pressure relief valves resulted in injuries and/ or off-site consequences. Where identified, one of five root causes was typically listed as the reason for improper opening of the pressure relief valve:
- Loss of cooling in the system,
- Overheating of equipment,
- Extreme environmental conditions,
- Power failures, and
- Relief valve malfunctioned.
The first four root causes are related to the design and operation of an ammonia refrigeration system. The fifth root cause is related to the mechanical integrity of pressure relief valves. Hazard analyses should be conducted to identify the potential circumstances that are causing these pressure relief valves to open. Additional emphasis must also be placed on the design, operation, and maintenance of overpressure relief protection systems.
While reviewing the Ammonia Incident Database, a significant amount of time was spent trying to determine if any conclusions could be reached regarding safe operation of ammonia detection systems, emergency ventilation systems, and emergency shutdown systems. However, very few incidents in the database (fewer than 10) discussed ammonia detection systems, emergency ventilation systems, or emergency shutdown systems, so no conclusions were reached. The publicly available information was primarily based on initial incident reports, and any evaluations of mitigation devices most likely occurred at a later date and not publicly available. The only way to obtain data on ammonia mitigation systems seems to be obtaining incident investigation reports directly from facilities that operate ammonia refrigeration systems.
9. Incidents with Catastrophic Consequences
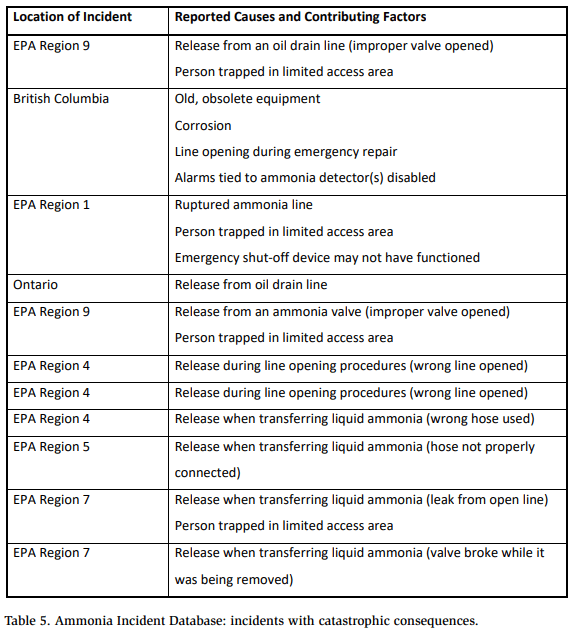
The Ammonia Incident Database indicated nine incidents that resulted in fatalities at facilities operating ammonia refrigeration systems and two incidents resulting in fatalities at ammonia storage terminals. Table 5 summarizes these incidents. Two issues must be emphasized based on a review of these catastrophic incidents:
- Nine of the 11 incidents were related to line opening, liquid transfer, or oil draining operations. This supports the hypothesis that these operations are the most hazardous conducted in the ammonia refrigeration industry.
- Three of the 11 incidents involved persons trapped in limited access areas. The location of ammonia equipment and possible escape routes must be considered during the design of the system and all subsequent hazard analyses.
When designing, operating, maintaining, and especially when conducting a hazard analysis of an ammonia refrigeration system, the following questions must be addressed for every scenario that could potentially result in an ammonia release to prevent incidents with catastrophic consequences:
- How can the ammonia release be prevented?
- How can the ammonia release be detected?
- How can the persons in the area escape from the ammonia release?
- How can the ammonia release be stopped?
- How can the area be ventilated?
Conclusions
This paper assumes that (a) the number of ammonia incidents in the United States and Canada could be significantly reduced and (b) a study of previous incidents could help to determine the best methods for preventing and/or minimizing the consequences of future incidents. Through a review of incident data submitted to the EPA, incident data collected in response to an IIAR questionnaire, and incident data collected via publicly available sources, the following conclusions were reached for facilities operating ammonia refrigeration systems:
-
- The ammonia refrigeration industry should continue to promote inherently safer technologies, including designs that minimize the total ammonia charge and designs that eliminate the use of ammonia equipment outside of machinery rooms (Jordan 2009).
- Faulty and poorly maintained equipment were responsible for the largest number of incidents. These incidents are preventable through improvements to the system design (IIAR 2; IIAR 4) and mechanical integrity procedures (IIAR 6). In addition, facilities should identify and replace older, obsolete equipment on a timely basis.
- Line opening operations, along with liquid transfer and oil draining operations, were responsible for the second largest number of incidents and the majority of incidents with catastrophic consequences. These incidents are preventable through the application of engineering controls (such as spring-loaded valves and pump-out systems (Engle et al. 2006))
and administrative controls (such as line opening procedures (IIAR 7), written operating (IIAR 7) and written maintenance procedures (IIAR 6), and training for system personnel). In addition, during liquid transfer operations, facilities must ensure that the transfer line/hose is suitable for has been properly maintained, and contains appropriate devices to limit the size of an ammonia leak if the line/hose were to rupture. - The design and operation of the ammonia refrigeration system should address persons who could be trapped in limited access areas when ammonia is released. Specifically, the following options should be considered, preferably in this order:
- Relocate the ammonia refrigeration equipment,
- Provide a secondary (back-up) emergency exit, and
- Provide personal protective equipment (PPE) that would enable personnel to escape the area in an emergency.
- The majority of the outdoor releases (~73%) identified in the Ammonia Incident Database were releases from pressure relief valves. Hazard analyses should be conducted to identify the potential circumstances that cause these pressure relief valves to open. Additional emphasis must also be placed on the design, operation, and maintenance of the overpressure relief protection systems.
- Additional emphasis is needed to protect refrigeration equipment from motorized equipment, especially forklifts, and from damage caused by structural or building failures.
- Many incidents occurred during the commissioning and the decommissioning of ammonia refrigeration systems. IIAR has written standards addressing these situations (IIAR 4; IIAR 5; IIAR 8).
- Fires affecting ammonia refrigeration systems were responsible for approximately 5% of the incidents in the database. These incidents may be prevented and/or minimized through the implementation of hot work permit procedures, the relocation of flammable materials, and improvements to fire suppression systems.
- Adverse incidents continue to occur in the ammonia refrigeration industry (approximately one incident every three to six days), and these incidents often result in people being injured and sent to the hospital for treatment (more than 1,500 during a 14-year period).
Finally, IIAR and its members should continue the study of incidents in the ammonia refrigeration industry. Specific recommendations along these lines include
- Contact EPA and/or the Chemical Safety Board to determine if additional, up-to-date data can be obtained from EPA’s five-year accident history database.
- Contact IIAR members to determine if they would be willing to share, on a confidential basis, reports conducted to investigate incidents that have occurred in their ammonia refrigeration systems.
References
CSB (U.S. Chemical Safety and Hazard Investigation Board). 2004. Information obtained during internal briefing conducted by the U.S. Chemical Safety and Hazard Investigation Board in 2004 to CSB members and members of the IIAR Ammonia Release Task Force. Washington, DC.
Engle, D., Hinds, K., and Jordan, P. 2006. “The joy of pump-out systems.” Presented at the 28th Annual IIAR Ammonia Refrigeration Conference & Exhibition, 2006, Reno, NV.
EPA (Environmental Protection Agency). (1994). 40 CFR Part 68, accidental release prevention requirements: risk management programs under Clean Air Act. Washington, DC.
—. (2001). “Hazards of ammonia releases at ammonia refrigeration facilities (update).” EPA 550-F-01-009, August. Washington, DC.
—. 2009. “Chapter 3: five-year accident history,” General Risk Management Program Guidance. Washington, DC.
IIAR. (202X). “Standard for minimum system safety requirements for existing closedcircuit ammonia refrigeration systems,” BSR/IIAR 9-202X. Alexandria, VA.
—. (2004). “IIAR Ammonia Release Task Force mission statement.” Alexandria, VA.
—. (2008). “IIAR ammonia release questionnaire, May 5, 2008.” Alexandria, VA.
—. (2009). “IIAR ammonia incident survey: survey results.” Alexandria, VA.
—. (2014). “Standard for safe design of closed-circuit ammonia refrigeration systems,” ANSI/IIAR 2-2014, Addendum A. Alexandria, VA.
—. (2015). “Installation of closed-circuit ammonia refrigeration systems,” ANSI/IIAR 4-2015. Alexandria, VA. —. (2015). “Decommissioning of closed-circuit ammonia refrigeration systems,” ANSI/IIAR 8-2015. Alexandria, VA. —. (2019). “Start-up of closed-circuit ammonia refrigeration systems,” ANSI/IIAR 5-2019. Alexandria, VA. —. (2019). “Standard for inspection, testing, and maintenance of closed-circuit ammonia refrigeration systems,” ANSI/IIAR 6-2019. Alexandria, VA. —. (2019). “Developing operating procedures for closed-circuit ammonia refrigeration systems,” ANSI/IIAR 7-2019. Alexandria, VA.
Jordan, P. (2009). “Considerations for an inherently safer ammonia refrigeration system.” Presented at the 31st Annual IIAR Industrial Refrigeration Conference, 2009, Dallas, TX.
OSHA (Occupational Safety and Health Administration). (1992). 29 CFR 1910.119, Process safety management of highly hazardous chemicals. Washington, DC: U.S. Department of Labor.
Wikipedia. (2019). “Google alerts.” [https://en.wikipedia.org/wiki/Google_Alerts], obtained on October 29, 2019.
Acknowledgments
The author would like to acknowledge the past and current members of IIAR’s Ammonia Release Task Force and IIAR’s Standards Committee for their efforts in promoting ammonia safety as described in this technical paper.