


2025 Technical Paper #13
Using Scorecards to Manage and Improve your RMP/PSM Program
Author: Nikolaus Despain CRL, APSM
Abstract
As resources get harder and harder to find, we need to explore other ways to help us be effective and make good decisions. For a single plant or a corporation with multiple plants, having good information available helps us leverage our resources for the most impactful decisions. Having an Auto-Populated RMP/PSM Scorecard can help us pinpoint specific problems quickly. A great Scorecard would include information regarding every element. It should provide instant knowledge of the current status of each element and quick identification of gaps and opportunities that need to be addressed. By autopopulating that information from your data sources, you can spend less time gathering the information and more time addressing the issues and opportunities. Scorecards can be in multiple formats, using a spreadsheet type tool makes the use of Scorecards a universal option for all. One size does not fit all, but the concept and idea can be adjusted to fit specific user needs.
An effective RMP/PSM Scorecard provides timely information. Examples of a useful RMP/PSM Scorecards will be shared, including ways to calculate various components of the elements, numerically and graphically, to better visualize gaps and opportunities. Also included are ways to auto extract the data, perform “what if…” or “where is…” scenarios on the scorecard to pinpoint specific opportunity areas and/or facilities – a practical idea that can be adjusted to the needs of the user.
A specific example will be shown how the use of an effective RMP/PSM Scorecard to measure the True Health of a Program, showed significant improvements in Element performance, that would have otherwise never occurred! The improvements would not have occurred, because the improvement opportunities were not properly identified without the Scorecard.
Introduction
You can’t improve what you don’t measure.
With multiple elements in RMP/PSM, how do you come up with a measurement system that can include all elements? What is measured? How often do we measure it? How do we share it so that it makes sense to others (outside of the RMP/PSM World e.g. Operations VPs, Directors, Plant Managers).
Key elements are:
- Make your Scorecard meaningful and useful.
- In a resource-limited environment, using meaningful data to make planned decisions, reduces unnecessary work and allows us to get more done.
- A Meaningful and Useful Scorecard invites other departments to participate in a facility wide process by making it visually appealing and personally useful to everyone.
- A meaningful and useful Scorecard identifies areas that need more attention and prevents “hidden” issues from staying “hidden.” It allows you to put the right resources at the right place at the right time.
- Not using a Scorecard means the RMP/PSM program relies on an individual(s) who remembers everything and is responsible for everything.
- Understand what makes a good Scorecard.
- A meaningful and useful Scorecard identifies and address the entire program and allows unique focus for facility specific issues and opportunities.
- One size does not fit all.
- Adjustments over time allows the proper focus for building your RMP/PSM program.
- Leave with examples to consider or implement.
- Several Sample Scorecard solutions will be provided.
- One size does not fit all, but researching multiple options can provide insight to your Scorecard Needs.
Make Your Scorecard Meaningful and Useful
As resources get harder and harder to find, we need to explore other ways to help us be effective and make good decisions. For a single plant or a corporation with multiple plants, having good information available, helps us effectively utilize our resources for the most effective decisions. A great Scorecard would include information regarding every element. Information that would provide instant knowledge of the current status of each element and quick identification of gaps and opportunities that need to be addressed.
What to Score
Each Element does not need to be scored the same way. Some elements by nature of their activity and resulting actions merit more detailed focus than others.
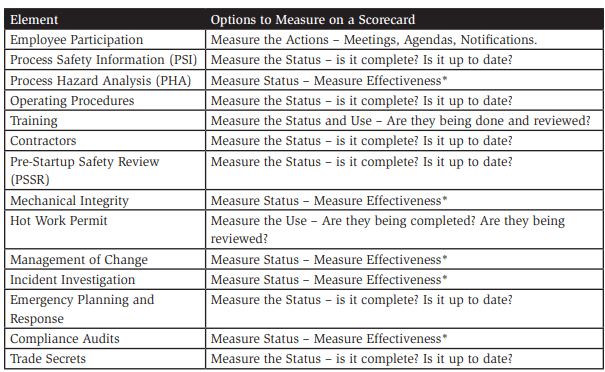
As you can see from the table, some elements simply need to be measured for Use or Status. There are five elements noted with an asterisk (*) that we have developed an “Effectiveness” measurement that goes deeper than simply Use or Status. [You could take the “effectiveness Measurement and apply it to ALL elements through an annual element review (each element needs to be reviewed for compliance and open items 1x per year then un-reviewed or open items can then be measured for “Effectiveness”) – thus becoming part of the “Effective” measurement process – more on this in the example below].
Measure the Actions/Status: Is It Complete? Is It Up to Date?
A simple process for measuring the status of items is to clearly identify what needs to be done for compliance – Then check to see if it is “in compliance.”
Example
Element = Employee Participation
Policy states that we will have monthly meetings with agendas and a minimum of six 6 employees in attendance.
The simple measurements are:
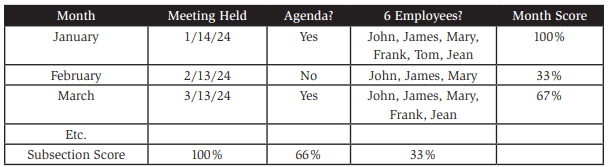
Depending on other factors or issues you can either use a weighted average or simple average of the results by YTD or by Monthly Scores –
YTD simple average = 66%
Measure Status – Measure Effectiveness*
If we use a simple “status” or “use” measurement on these activities, we miss a significant opportunity to identify the “health” of our program. Often time we put programs in place with good intentions of getting things down, but through unintended oversights, we lose some follow-up action items that can come back and “bite” us.
A way to measure “effectiveness” for these elements is to calculate the percent “completion” scaled 0%-100% and then deduct “penalties” for open items that are past due or do not have a due date assigned.
For example –
Calculate the Percent Completion by totaling up all the questions (denominator), Calculate the number of questions that are “complete” (numerator).
So,
Denominator = 145
Questions Numerator = 135
Completed Actions 135/145 = 93.1%
93% indicates we are OK and have a few things to finish, but it doesn’t tell the whole story… What if this audit is from last year, shouldn’t these activities be completed already? What if we scored these items slightly different…
Let’s add some penalty points:
- 1 point (percentage point from previous calculation) deducted for every Month past the indicated due date for the question or recommendation that is not complete.
- A 12 point deduction for any question or recommendation that is not complete and does not have a due date.
So, if there are 10 items that have been forgotten and no due date was ever established, we could go on forever, not completing these, until an auditor asks us why we aren’t taking the program seriously, or we can get a revised score…
135/145 = 93.1% ó 93.1% – (10 items x 12 points) = -26.9% (cap at 0%) ó 0% on this audit.
If we were to see 93.1% our reaction might be low. However, if we saw a 0% score, questions would be asked. Those questions would lead to the 10 forgotten items…
Let’s recalculate as if the 10 items were only 3 months overdue…
135/145 = 93.1% ó 93.1% – (10 items x 3months X 1 point/month) = 63.1% in this scenario.
While 63.1% is not a zero, it should still generate questions – the purpose of a scorecard!
Another interesting note – if you trend it month to month and don’t make any changes, you will see the score drop with no changes as opposed to no weights that would show the same score every month and not increasing concern.
Other Variations
While this works well for audits, some activities like incident investigation or management of change (MOC) action items don’t follow as well as an audit.
One of the ways to use the open items in these areas (Incident Investigation, MOC) is treat them as “open” items and deduct penalties from the compliance section.
So, back to our 93.1 percent audit (135/145), if we have open Incident items or MOC items that meet our penalty criteria –
- 1 point (percentage point from previous calculation) deducted for every Month past the indicated due date for the question or recommendation that is not complete.
- A 12 point deduction for any question or recommendation that is not complete and does not have a due date.
We perform the same deduction on the Audit Score –
NOTE: We chose the audit score in a scenario where incidents and MOCs are not being tracked separately on a scorecard, making it an Audit/MOC/Incident score instead. You can add elements like this to any score, or even deduct important non PSM items. Five (5) Incident Investigation issues, only one (1) is six (6) months late…
93.1% – (One late issue X 1 point/month X 6 months) = 87.1%
Not a big issue, but the numbers can build when you have numerous outstanding issues to resolve!
What about PHAs or MIs that have a risk ranking factor to determine priorities?
Instead of deducting 1 point for each open item, we use the risk ranking factors –
- “A” Items are worth 1 point
- “B” Items are worth 0.75 points
- “C” Items are worth 0.5 points
- “D” Items are worth 0.25 points
Example – a PHA or MI with 40 recommendations (10 A’s, 10 B’s, 10 C’s and 10 D’s):
[10 A’s * 1] + [10 B’s * 0.75] + [10 C’s * 0.5] + [10 D’s * 0.25] = 25 possible pointsIf all are complete except for one (1) A and two (2) D’s:
[9 A’s * 1] + [10 B’s * 0.75] + [10 C’s * 0.5] + [8 D’s * 0.25] = 23.5 pointsSo –
23.5 completed points / 25 possible points = 0.94 or 94%
Whereas, If the risk ranking values are not used –
40 recommendations = 40 possible points.
Three (3) items not complete (the A and two D’s from above) –
37 points / 40 possible points = 0.925 or 92.5%
At this point, the penalties are included. The deductions are similar to the Audit scoring method – The penalties are included for the Recommendation that is not complete.
- For all items – 1 point deducted for every Month past the indicated Due Date.
- A 12 point deduction for any recommendation that is not complete and does not have a due date.
Extracting the Data
If your data is in a database:
- Extract raw data via SQL or some other tool (some calculations can occur).
- Import data into viewer tool (MS Excel, MS PowerBI, etc.).
- Build views based on your criteria.
If you don’t have access to the database but you get reports:
- (If your reports are in a PDF format, convert to Excel).
- Use a tool like Excel (using VBA) to extract the pertinent data and build your own Warehouse Data.
- Import data into viewer tool (MS Excel, MS PowerBI, etc.).
- Build views based on your criteria.
Understand What Makes a Good Scorecard
A meaningful and useful scorecard identifies and addresses the entire program in a way that allows the scorecard users a quick and effective way to determine their program effectiveness. One size does not fit all – sometimes the focus needs to be different for the company, sometimes different for struggling facilities. An effective scorecard needs to adapt and change as your program needs different focus areas to develop into a robust program.
An out of control program can have a scorecard that helps identify the big problems and address them. The site needs to focus on the big things first before addressing smaller details that will eventually be their biggest problem. Once those have been cleaned up, you will want to expand the scorecard to identify the next level of problems. Then the next level after those biggest problems are fixed. Continuous improvement will allow a site to get to a point where what was once their smallest problem is now their biggest or problems that were not apparent due to the amount of large problems will become visible. This is only possible with continued adjustments to the scorecard parameters.
Scorecards cannot be a resource drain – spending too much time making the scorecard takes away time from analyzing the scorecard and developing plans for improvement. If it takes a week or month to process the data, it is already outdated by the time it is available to act on.
Use a tool that is easier and familiar to you and your company. Microsoft Excel is a very common spreadsheet tool and available in most companies. A newer tool that is quite effective is Microsoft PowerBI. Below are examples of Scorecards using both tools (Microsoft Excel & Microsoft PowerBI).
Examples – Microsoft Excel
With your data in a table format, Microsoft Excel has quick charting capabilities –
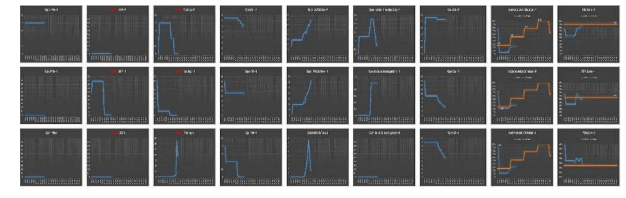
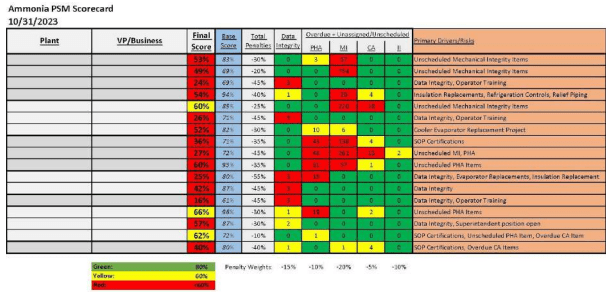
Or you can keep it in a table format with color coding –
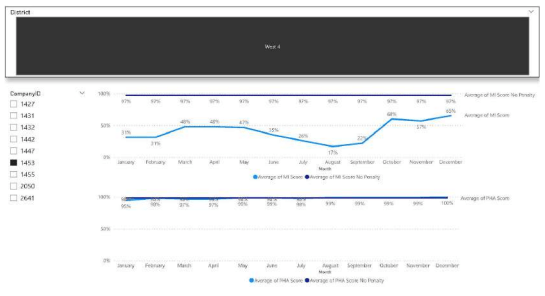
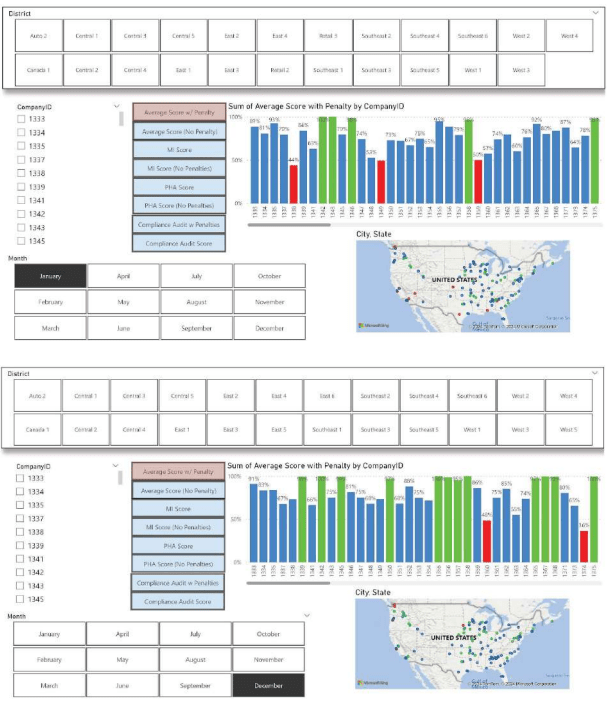
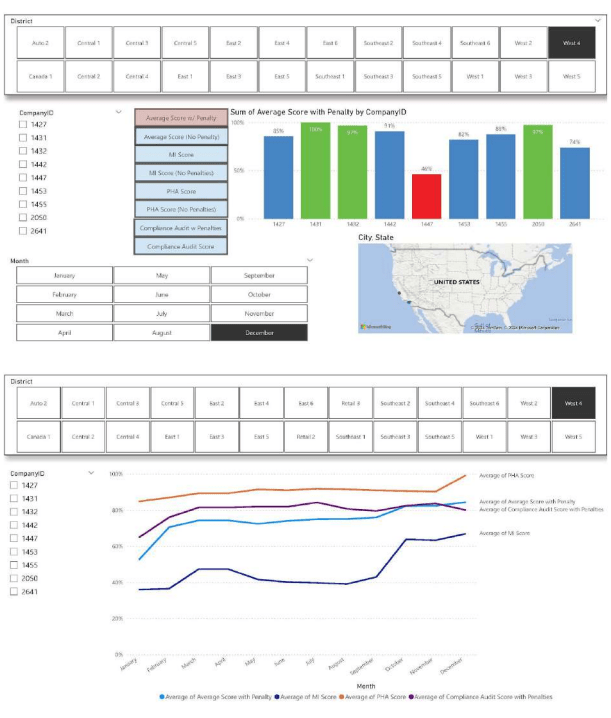
Examples – Microsoft PowerBI
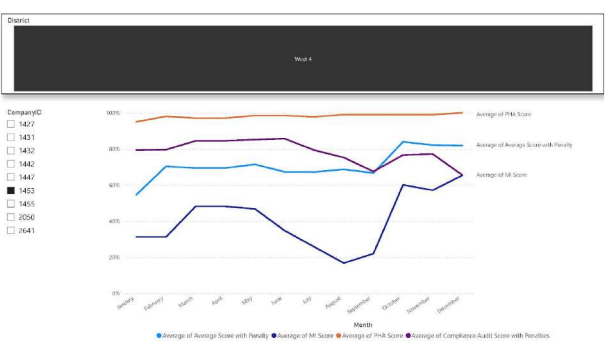
With Microsoft PowerBI, the charting & filtering with visuals is greater –
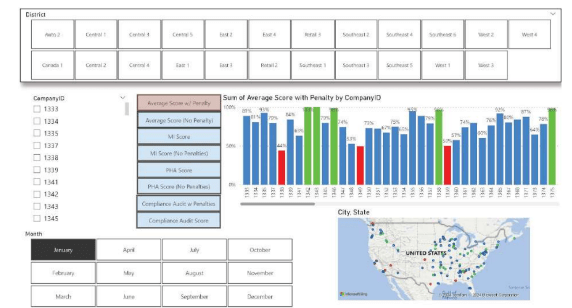
The filtering allows you to view “What if” scenarios or even compare “with” and “without” penalties –
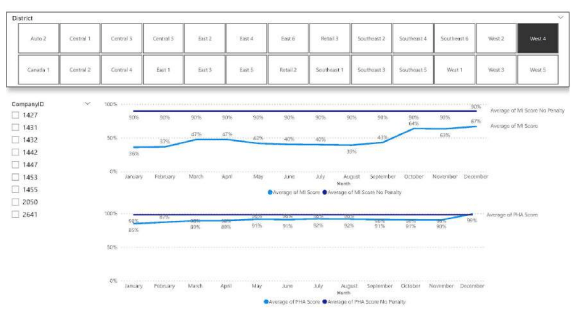
The comparisons can show the value of some sort of penalties –
Scorecard Example.
Conclusion
In a resource limited environment, exploring other ways to help us be effective and make good decisions is critical. For a single plant or a corporation with multiple plants, having good information available helps us leverage our resources for the most impactful decisions. An effective RMP/PSM Scorecard provides timely information. Using a Scorecard can help you manage and improve your RMP/PSM program.
References
All data and reference information comes from current work and development from APSM Portal and Catalyst Systems.
Microsoft Excel and Microsoft PowerBI are the tools used for the scorecards in this paper.