


Identifying and Quantifying Fugitive Emissions from Industrial Refrigeration Systems
Marc Claas, Research Engineer; Douglas Reindl, PhD, PE, Director; Todd Jekel, PhD, PE, Assistant Director; John Davis, PE, Associate Researcher; Jacob Grayless, Research Intern; University of Wisconsin-Madison Industrial Refrigeration Consortium (IRC)
ABSTRACT
Industrial ammonia refrigeration systems vary widely in their engineering design, size, scope, and technology features. However, they universally experience some level of refrigerant loss throughout their operational life. Refrigerant losses from industrial ammonia refrigeration systems originate from any number of sources including uncontrolled releases from incidents and accidents, intentional releases during maintenance activities, and fugitive emissions.
This paper discusses methods for finding and quantifying fugitive emissions of ammonia from industrial refrigeration systems with the goal of reducing refrigerant losses that occur from these systems. From the outset, the working hypothesis is that fugitive emissions represent a significant contribution to the overall refrigerant loss rate for industrial refrigeration systems. Since there has not been an organized effort to identify and quantify fugitive emissions associated with industrial ammonia refrigeration systems, this hypothesis needed to be tested as a prerequisite to establishing approaches to reduce refrigerant losses.
Field work identifying and quantifying refrigerant losses, including fugitive emissions, was performed on six (6) industrial ammonia refrigeration systems located at five (5) plants. A total of one-hundred seventy-five (175) components were surveyed with one hundred fifty-nine (159) scanned and one hundred ten (110) bagged for emission collection. For components surveyed with measurable refrigerant fugitive emissions, the average leak rate was 0.086 lbm/year [39 gram/year]. The average of all sampled components was 0.035 lbm/year [16 gram/ year]. If a hypothetical refrigeration system is comprised of 1,000 components leaking at this average fugitive emission rate, the total refrigerant loss from fugitive emission for this system would total 35 lbm/yr [16 kg/yr]. Comparatively, the average annual total refrigerant purchased for the plants surveyed was 1,660 lbm/yr [755 kg/ yr]. Based on these findings, fugitive emissions, as a refrigerant loss category, are not a significant contributor to annual refrigerant loss. The two categories of refrigerant losses that appear to more meaningfully contribute to the annual total are accidental releases and intentional venting in conjunction with servicing and maintenance activities. No specific assessments for these two loss categories were systematically conducted as part of the present study so these loss categories were not separately tracked. Also proposed is a method for dynamically tracking the quantity of refrigerant in a system as a means of highlighting occurring losses so staff can find and repair the leak source more promptly than current practice.
Introduction
Fugitive emissions: The unintended loss of refrigerant from a refrigeration system that goes undetected.
Refrigerant losses from refrigeration system sources including accidental releases, venting during maintenance, and fugitive emissions occur during normal operation. Section 608 (40 CFR Part 82, Subpart F) of the Clean Air Act mandates that losses of ozone-depleting fluorochemical refrigerants used in industrial systems be under 30% per year as a threshold that triggers owners to pursue refrigeration system leak repairs. Because ammonia has no ozone-depletion potential, it is not subject to the regulatory requirements of Section 608. Nonetheless, there is interest within the natural refrigeration community to reduce losses of ammonia from refrigeration systems as a means of pollution prevention, risk mitigation, and reducing refrigerant replenishment costs.
For over a decade, the University of Wisconsin-Madison Industrial Refrigeration Consortium (IRC) has gathered anecdotal evidence from the field that indicate industrial refrigeration systems exhibit a wide variation in annual refrigerant losses that range from 1% to more than 100% per year. This wide variation raises several questions. Why is the annual refrigerant loss rate so variable from system to system? What is the origin of refrigerant loss from these systems and is there a common thread that enables the losses? Is there a reasonable threshold for annual refrigerant losses that could be applied to industrial refrigeration systems? To what extent do fugitive emissions contribute to the overall annual refrigerant loss rate for industrial systems? Answering these questions served as motivation for this project.
Losses of refrigerant from vapor compression-based refrigeration systems can be categorized as “known” or “unknown.” Known losses can be either quantified or unquantified. Known losses from ammonia refrigeration systems include moderate to large accidental releases as well as venting of ammonia as a part of maintenance activities. In these cases, facility personnel are aware or know that a refrigerant loss has occurred. In an accidental release, end-users must quickly determine if the quantity of refrigerant released exceeds the reportable quantity threshold of 100 lbm [45.4 kg] for anhydrous ammonia so appropriate notifications can be contacted. At the federal level, 40 CFR 302 and 40 CFR 355 establish notification requirements related to accidental refrigerant releases, while some states and local jurisdictions have additional reporting requirements. During an incident investigation of an accidental release, end-users will often refine the initial estimate of refrigerant quantities released. Known losses that are rarely quantified relate to smaller, incidental mechanical integrity failures of seals or joints, or ammonia that is discharged or vented during system maintenance activities.
Unknown losses include fugitive emissions and accidental leaks/spills that do not rise to the level of triggering an alarm or other notification system. This paper reports on a project that examines the prevalence of fugitive emissions in industrial ammonia refrigeration systems and assesses their total contribution to the overall losses a given refrigeration system may experience on an annual basis (Reindl, et al. 2020a).
In some cases, unknown losses can be masked or hidden by an intervening media. Two classic examples of ammonia losses that can occur over relatively long periods of time before being discovered are evaporative condenser tube leaks and losses through malfunctioning autopurgers. In both cases, the “intervening media” is water. Because evaporative condensers circulate water over the outside of the refrigerant heat exchanger, smaller refrigerant leaks from the heat exchanger are readily absorbed into the condenser water. In the case of an autopurger, non-condensable gas (primarily, air) is directed through a water column to absorb expected trace amounts of ammonia vapor that co-exist with the non-condensable gas being expelled from the air separation chamber of the autopurger. In cases where the autopurger malfunctions, larger amounts of ammonia can be discharged from the purger with the water column masking the release by absorbing the ammonia.
Principles and Technologies for Finding Fugitive Emissions
Given that loss rates are often extremely small, fugitive emissions are difficult to find. In the sections that follow, we discuss approaches and equipment that can be used to locate refrigerant leaks, even in cases where no ammonia odor is readily detectable. More importantly, we show methods of measuring fugitive emissions to quantify leakage rates.
Detecting Ammonia Leaks
Locating and repairing small refrigerant leaks is an important part of safely operating any process, particularly one in which the refrigerant poses a hazard. Even small refrigerant leaks can indicate a variety of system issues, from a loss of mechanical integrity to malfunctioning safety systems to inadequate routine repairs. Small refrigerant leaks are most often discovered by qualitative means such as odor, with subsequent use of sulfur sticks or an ammonia detector to pinpoint the location. There are techniques that can quantitatively measure rates of refrigerant loss from small leaks, including fugitive emissions.
Qualitative Leak Detection
The most common way of detecting ammonia leaks is by the presence of ammonia’s distinct odor. Once the odor is discovered or reported, plant personnel will follow up and pinpoint the leak source using simple tools such as a sulfur stick or litmus paper. Sulfur sticks consist of a wick material covered with a sulfur-laced wax. When the wick is lit and burning, sulfur liberated by the flame will react with airborne ammonia to produce ammonium sulfate which results in a distinct white wispy cloud appearance that will help the responding technician locate the leak source. Some technicians prefer to rub wetted litmus paper along potential leak sites. The presence of ammonia will cause the litmus paper to turn blue, with a darker color change correlating to a higher ammonia concentration due to the alkaline nature of ammonia.
Ammonia leaks can be detected in the air using a variety of detector technologies such as chemical, photoionization, catalytic bead, and infrared. These technologies are commonly deployed in both handheld and fixed devices. For this project, a handheld ammonia detector was used to quantification refrigerant leaks in a process referred to as “screening.”
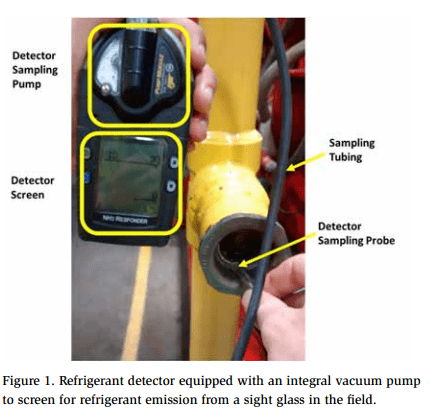
Screening involves holding the ammonia detector, preferably with an onboard sampling pump and probe, close to the potential leak site (gasketed connections, screwed connections, stem packing, etc.). This approach can identify a location with ammonia concentration at or above the sensor’s limit of detection. An example setup is shown in Figure 1, where a sight glass is being screened for ammonia leakage by using the detector’s sampling probe to carefully traverse the face of the glass and retaining ring to “sniff” for the presence of ammonia. If ammonia is detected, the component is then bagged to quantify the actual leak rate.
Fixed-mount refrigerant detectors enable remote monitoring of locations that contain refrigeration. In the event of a refrigerant release, ammonia sensors provide a warning to personnel for safety, trigger engineering controls, and alert plant personnel so the leak can be mitigated. In some cases, measured airborne concentrations of ammonia can be used to estimate release quantities during subsequent incident investigation activities. Likewise, handheld detectors are used to monitor concentrations during response or maintenance activities for safety purposes. Although not required by industry codes and standards, many plants have deployed ammonia detectors within pressure relief vent-line piping to alert plant personnel if a relief valve has actuated. The sensors used in this application typically require a comparatively high limit of detection (4,500 ppm or higher). The high detection limit for relief vent line sensors may not detect if one or more relief valves may be exhibiting fugitive emissions via refrigerant weeping through valve seats.
Another potential means of identifying leaks is the use of thermography. Gas detection thermography relies on filtering the specific infrared wavelength emitted by the gas molecule being targeted and highlighting those wavelengths on a user screen. An uncooled, gas-specific prototype unit was employed during this project. The camera was used to visualize controlled leaks from a cylinder of anhydrous ammonia. The camera could readily detect leaks at comparatively high release rates on the order of 9.8 lbm/day [4.4 kg/day]; however, we did not experiment with identifying a lower limit of detection for much lower leak rates more typical of fugitive emissions. The release rates required to identify flow on the screen far exceeded the odor threshold and could easily be picked up using alternative means such as an ammonia detector or sulfur stick.
Finally, ultrasonic detectors are commonly used to pinpoint leaks in compressed air systems. We evaluated this technology for its potential application to locate and quantify ammonia vapor leaks; however, we concluded it is not sufficiently sensitive to detect the low leak rates associated with fugitive emissions.
Quantitative Leak Detection
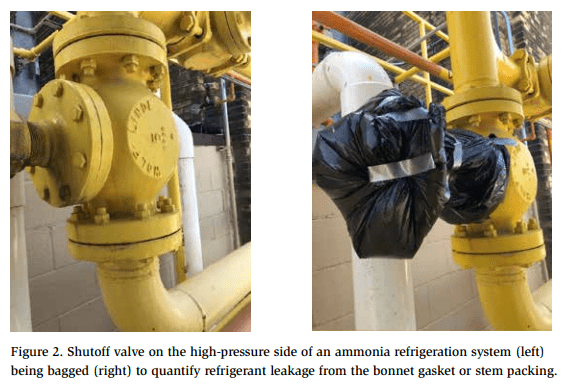
Once identified, fugitive emissions of ammonia were measured in the field by bagging. Bagging involves enclosing a leak site within a plastic bag and inducing a flow through the bag across the leak site, as shown in Figure 2. A schematic of bagging setup used for larger leak rates during the project is shown in Figure 3.
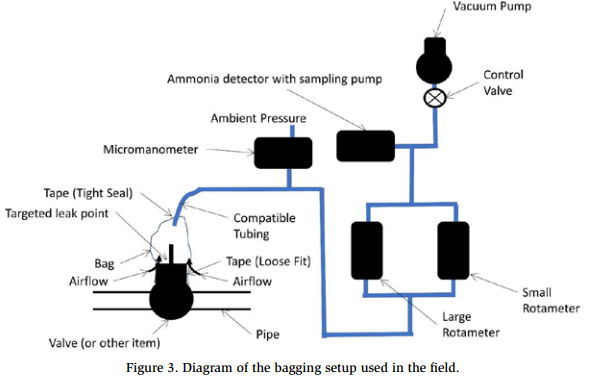
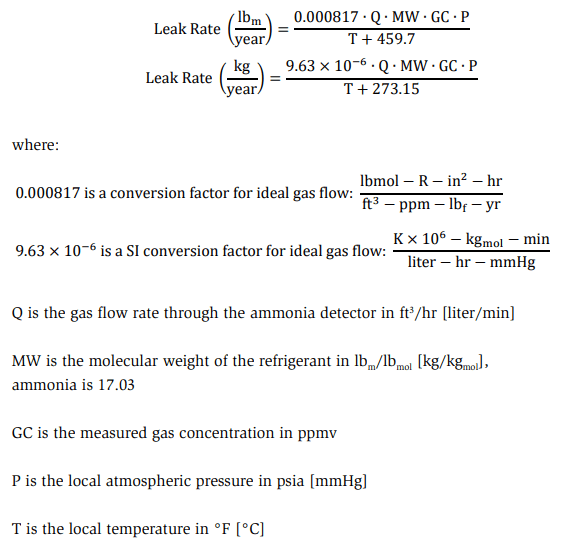
The following provides a method for calculating the leak rate for a bagged component wherein the microenvironment within the bag is being sampled with an ammonia detector using a known gas flow rate, measured concentration, local atmospheric pressure, and local temperature (EPA, 1995, pp. 4-9)
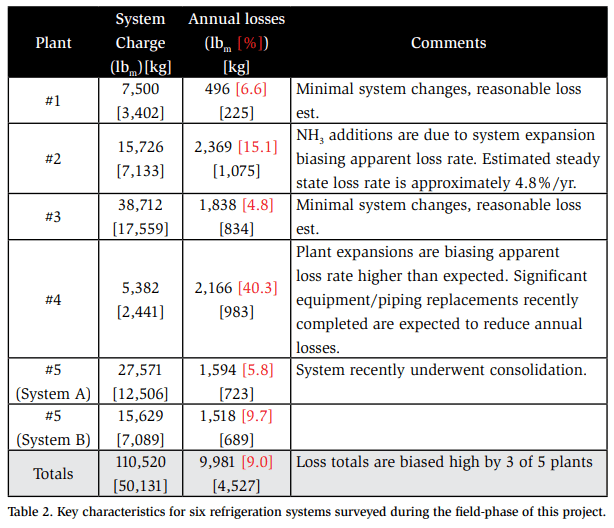
Bagging was found to be an effective way to measure a wide range of refrigerant release rates because the air flow through the bag can be controlled using a vacuum pump to maintain the mixture within the ammonia detector readable range. The ammonia detector used during this project is equipped with two (2) separate sensors: a photo ionization detector (PID) for sensing lower concentrations of ammonia (0-1,000 ppm) and a catalytic bead sensor for detecting higher concentrations of ammonia (4,500 -150,000 ppm). Figure 4 shows the effective leak rate measurement range as a function of ammonia concentration over the range of the PID sensor.
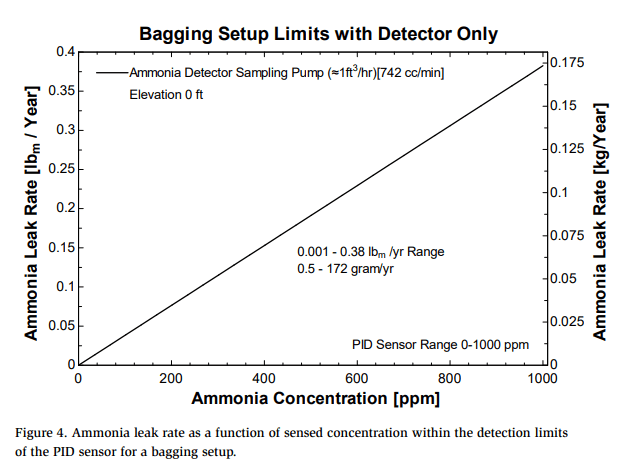
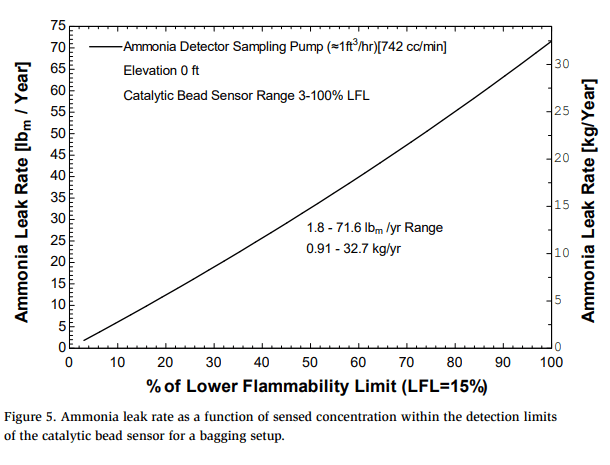
At the upper limit of detection for the PID sensor (1,000 ppm), the maximum leak rate corresponds to 0.38 lbm/yr [0.17 kg/yr]. Figure 5 shows the effective leak rate measurement range as a function of concentration for the catalytic bead sensor. In this case, the lower limit of detection for this sensor is 3% of the lower flammability limit (LFL, 4,500 ppm) and the corresponding lowest leak rate is 1.8 lbm/yr [0.82 kg/yr]. Because the handheld ammonia detector has its own fixed-speed sampling pump, decreasing the sampling pump’s flow rate is not an option, as the unit alarms and requires a pump restart when a decrease in gas flow rate is detected. Without the use of a separate vacuum pump to dilute the bagged concentration of ammonia by increasing airflow, there is a gap in leak rate measurement capability using the handheld detector alone.
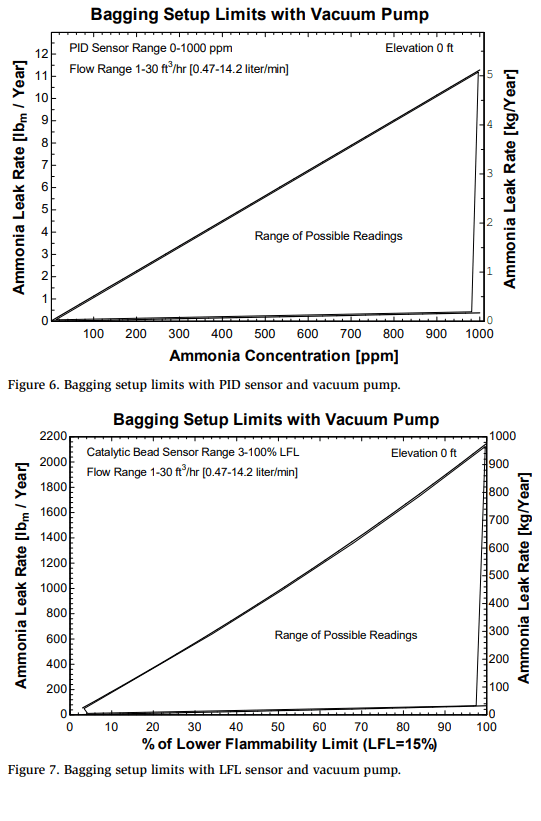
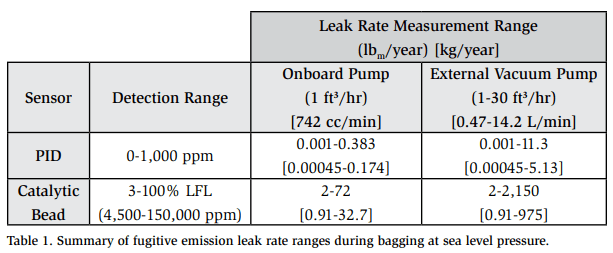
A wider range of leak rates can be measured when a separate vacuum pump is deployed, as quantified in Figure 6 and Figure 7 and summarized in Table 1. The separate vacuum pump allows a greater flow rate of ambient air to be drawn through the bagged component to further dilute the ammonia concentration within the bag’s microenvironment. Varying the flow rate allows for coverage of the gap noted previously, and extends the measurement range up to 2,000 lbm/yr [907 kg/yr] of ammonia vapor. For liquid leaks, other means must be used to measure the liquid release rate. Refer to IRC (2020b) for further details on measuring leak rates using a handheld detector alone or in conjunction with a separate vacuum pump.
Multiple sources contribute to the uncertainty in measuring fugitive emission leak rates. A relatively small contribution in uncertainty comes from variations in ambient temperature, humidity, and altitude. The primary source of uncertainty is the measurement of the total gas flow rate. The leak rate uncertainty due to the gas flow meter decreases as the flow rate increases. Two (2) rotameters were used during the project included a 0-1,000 cc/min unit and a 0-20 L/min unit, and the uncertainty for these flow meters is lowest when the gas flow is kept in the top half of the scale for each.
Fugitive Emissions: Field Experience and Findings
Field work conducted at five (5) facilities included a total of six (6) refrigeration systems. Table 2 summarizes key characteristics for each of the plants and their refrigeration systems. Detailed refrigerant inventory calculations were performed for each system to establish benchmarks for their “maximum intended refrigerant inventory.” An analysis of historical ammonia purchases was performed to estimate the annual refrigerant loss rate.
The smallest system was Plant #4, with an operating refrigerant inventory of 5,382 lbm [2,441 kg], while Plant #3 was the largest with a refrigerant inventory of 38,712 lbm [17,559 kg]. The annual refrigeration loss estimate for Plant #4 is based solely on ammonia purchases totaling 2,166 lbm [982 kg] (40.3%). However, this plant was undergoing an expansion with significant piping modifications still in progress during the time of our plant visit, so the refrigerant purchases are not solely reflective of refrigerant losses. Plant #3 provided a good estimate of the annual refrigerant loss quantity at 1,838 lbm [834 kg] (4.8%) because no significant modifications have been made to this system over the time period analyzed.
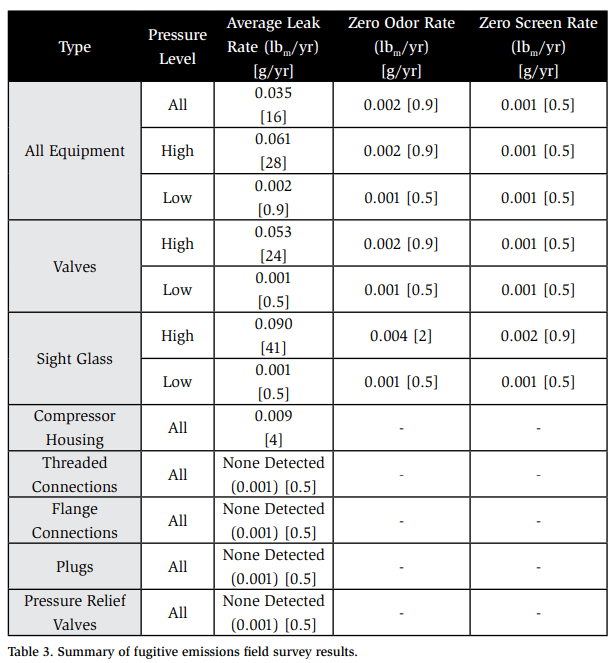
The primary purpose of conducting field work at the facilities was to find and quantify fugitive emissions of ammonia. A total of one-hundred seventy-five (175) different refrigeration system components were surveyed, including one-hundred fifty-nine (159) screened and one-hundred ten (110) bagged. Of the 175 components, a total of thirty-four (34) items had detectable refrigerant emissions, made up of twenty-one (21) sight glasses, twelve (12) system operating valves, and a compressor housing. Unexpectedly, the threaded connections, unions, flare fittings, flanges, check valves, plugs and pressure relief valves surveyed exhibited no fugitive emissions. Items with no detectable emissions were assumed to have a release rate below the lowest detectable level for this setup at 0.001 lbm/yr [0.5 gram/yr].
The average leak rates found during the present study are summarized below in Table 3. Although somewhat arbitrary, a pressure of 80 psig [552 kPag] was chosen as the transition from what was considered “low” pressure to “high” pressure. Nominally, the qualitative flags for “low” and “high” pressure correspond to the refrigeration system’s “high-side” and “low-side.”
In an ammonia refrigeration system during normal operation, condensing pressures below and refrigeration loads above 80 psig [552 kPag] are quite rare. For the facilities surveyed, the highest refrigeration evaporator pressure was 60 psig [414 kPag], while the lowest condensing pressure observed was 110 psig [758 kPag]. The “Average Leak Rate” for “All Equipment” corresponds to the one-hundred ten (110) bagged components. The “Zero Odor Rate” corresponded to the average leak rate of bagged components where ammonia was detected during the bagging process, but no ammonia odor was noticed by the staff member conducting the screening/bagging. The “Zero Screen Rate” is the average leak rate of bagged components which recorded a zero (0) screening value. Clearly, the leak rates on a per-equipment basis are quite low and, collectively, they did not approach the actual total refrigerant loss rate from each of the five facilities where field work was conducted. For a complete list of survey results, refer to IRC (2020a).
All plants had at least one component with fugitive emissions; however, we concluded fugitive emissions themselves did not rise to a level that accounts for significant refrigerant losses occurring for these refrigeration systems. For components surveyed with measurable refrigerant fugitive emissions, the average leak rate was 0.086 lbm/yr [39 gram/yr]. The average of all sampled components was 0.035 lbm/yr [16 gram/yr]. As an example, consider a given system with 1,000 components leaking at that average rate, the, fugitive emissions would total 35 lbm/year [16 kg/yr], yet the average annual total refrigerant losses for the five plants surveyed had apparent losses that were two orders of magnitude higher at 1,664 lbm/yr [755 kg/yr]. Based on our findings, fugitive emissions are not a significant contributor to the overall loss of refrigerant from industrial ammonia refrigeration systems. It appears that the two (2) categories of refrigerant losses that most meaningfully contribute to annual losses are accidental releases (small and large) and venting during system maintenance and repair.
Leak Rate Estimation of Small Releases
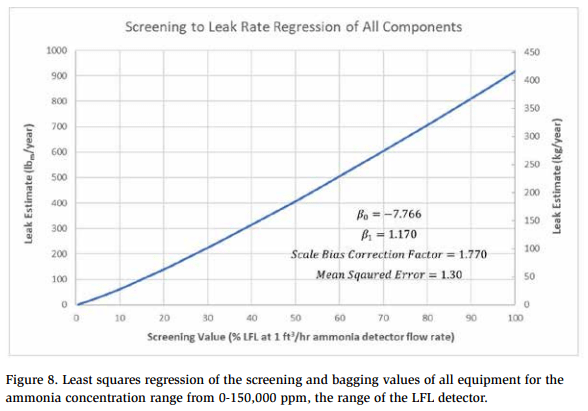
To relate screening values to actual emissions rates, a least squares regression, analogous to that of the EPA (1995), can be used. Ideally, this regression is prepared for each type or category of equipment; however, the equipment-specific instances of fugitive emissions found only produced enough data for regression of refrigerant sight glasses found on the high-pressure side of refrigeration systems. These sight glasses then dominated the regressions for both “all equipment” and “high-side equipment” categories.
The regression for screening all equipment using an ammonia detector drawing ~1 ft3 /hr [472 cc/min] through the sampling pump is shown in Figure 8. It would be expected that refrigerant detectors with higher gas flow rates would yield lower screening values for the same leak point due to dilution, and higher screening values for lower flow rate detectors due to less dilution. The actual relationship would need to be investigated further if a screening/bagging relationship is needed for other ammonia detectors or sampling flow rates. Most screening was conducted by moving the refrigerant detector’s probe tip in the immediate vicinity of the leak site while avoiding obstructing the probe and moving at a rate to accommodate the detector response time. Retracting the detector probe tip any distance away from the leak site creates lower screening readings for a given leak rate due to dilution of the sample drawn. Many small releases are not estimated due to the time required to directly measure the release rate coupled with the urgency of stopping known releases. Utilizing a least squares regression provides a fast, easy way to estimate release rates prior to repair, allowing facilities to better understand losses from these releases.
Dynamic System Inventory Tracking
The periodic addition of refrigerant to systems will equal the refrigerant losses during the interval unless the system has had components added or removed from the system, and the refrigerant level after the addition results in the same refrigerant levels in the system’s vessels. The concept of dynamically tracking the refrigerant inventory for the system over time can result in the ability to identify refrigerant losses. Because this is happening over time, losses can be noticed earlier than when compared to the lagging indicator of periodic purchase and addition of refrigerant to the system. Since industrial refrigeration systems may go one or more years between ammonia additions, a means of tracking refrigerant losses over a shorter time horizon would be desirable.
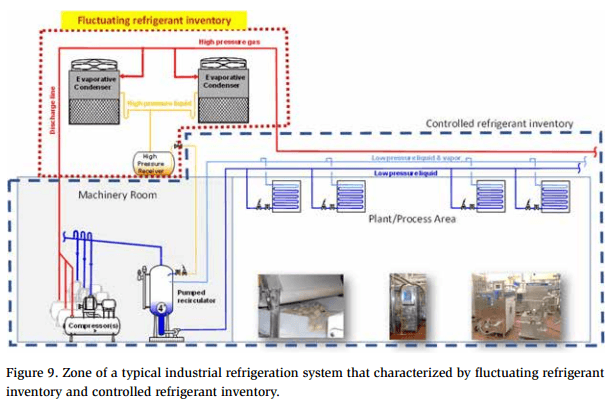
As refrigerant is lost or removed from the system and refrigerant inventory declines, the decline may be detectable by examining the inventory of refrigerant in a portion of a refrigeration system that has an uncontrolled refrigerant inventory. In most systems, this is the high-pressure receiver (HPR), as illustrated in Figure 9. Since the liquid refrigerant level in the HPR can fluctuate as refrigeration system operating conditions change, several liquid refrigerant level data points over days or weeks are required to begin establishing a clear trend in system refrigerant inventory. This technique is most effective for plants that have consistent operational profiles and where HPR level data are collected during periods of normal operation.
The HPR vessel operates at the system’s condensing pressure, and the amount of refrigerant in the HPR is driven by system dynamics with no active controls used to manage the HPR liquid refrigerant level. The dynamic system inventory tracking method presented here relies on these refrigeration system dynamics to average out over time so a clearer trend in refrigerant system inventory emerges.
The first step in tracking the dynamic system inventory for a plant is to calculate the total amount of refrigerant contained within that system. This is usually referred to as the “maximum intended inventory” or “refrigeration system charge.” Calculating the inventory requires accounting for all refrigerant contained within all vessels, piping, evaporators, condensers, and any other components that make up the refrigeration system. More guidance on conducting a refrigerant inventory calculation is provided in a separate document, IRC (2020b).
The next step is to determine which vessels will show trend in refrigerant loss. A basic system layout is shown in Figure 9 and is representative of many industrial ammonia refrigeration systems. The dashed lines shown in the figure divide the system into two parts: “controlled refrigerant inventory” and “fluctuating refrigerant inventory.” In the controlled inventory portion of the system, the refrigerant flows and liquid levels are actively managed. Pumped recirculation vessels and surge drums attached to gravity flooded evaporators are controlled to maintain a liquid level setpoint. Refrigerant make-up to these vessels is started or modulated as the level falls below setpoint and stopped when levels rise above setpoint. Evaporators tend to run with a relatively constant inventory during their normal cooling mode. As discussed earlier, the high-pressure receiver (HPR) does not operate at a controlled or fixed refrigerant level. As a result, the HPR is variable and will typically be the first vessel to indicate a dynamic trend in lower liquid levels when ammonia is lost from the system.
Every refrigeration system is unique, and some system designs/layouts may have more than one pressure vessel that must be incorporated into the “fluctuating inventory” portion of the dynamic charge calculations in order to provide a more accurate estimate loss the rate of refrigerant leaving the system. This can include systems with multiple high-pressure receivers; low-side vessels that vary in level such as accumulators (i.e., suction traps); or low-side vessels with variable level setpoints. Once the uncontrolled vessel(s) have been identified, the vessel size(s) must be measured or otherwise obtained from documentation to calculate the vessel’s refrigerant inventory for a given liquid refrigerant level. Once these items have been established, the dynamic inventory tracking can begin.
The dynamic inventory tracking involves periodically (e.g., daily) logging the liquid level in the HPR. The liquid level in a vessel is usually expressed as the liquid height from the bottom of the vessel as the reference point. This process is often accomplished during operator “rounds” performed at, nominally, the same time each shift or day. Preferably, the refrigeration system is operating normally at the time the liquid level is logged. If the HPR vessel level is logged multiple times a day, each log entry can be used in the inventory tracking, or the levels can be averaged to yield a single daily level.
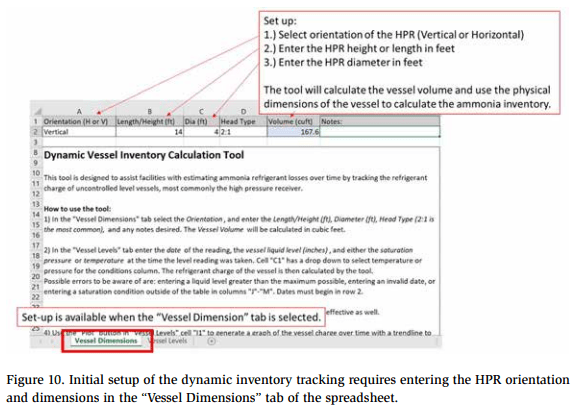
A dynamic inventory tracking tool was created to facilitate the process of trending refrigerant losses occurring with an ammonia refrigeration system. The process begins with entering the orientation and dimensions of the system’s HPR as shown in Figure 10. Upon completing the initial setup, the user would click on the “Vessel Levels” tab to enter collected data. Figure 11 shows the “Vessel Levels” tab with an example of the data entry for the tool that includes date, liquid level, and the system condensing pressure for each log condition entry. For each entry, the tool automatically calculates the information shaded in blue, including liquid and vapor density for ammonia, liquid and vapor volume, and total quantity or charge of ammonia in the HPR based on vessel dimensions and properties of ammonia.

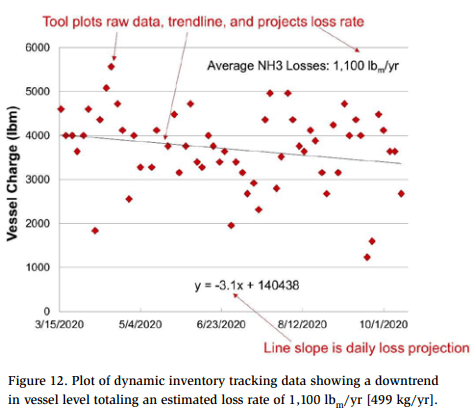
When several days or weeks or months of data have been collected, the user can click on the “Plot Data” button and the tool will automatically generate a plot that includes each of the entries as individual data points as well as a linear trendline applied to the entered data, as shown in Figure 12. The tool uses the trendline to estimate the annual average refrigerant loss rate (lbm/yr) as well as a curve fit to the trendline that includes an estimated daily loss rate based on the slope of the trendline (for the case shown in Figure 12, the daily loss rate is 3.1 lbm/day [1.4 kg/day]). Users of the tool should carefully inspect the plot of data points and identify if there are any outlier points that may be reflective of a data entry error. If errors are found, the user can make corrections to the corresponding data in the “Vessel Levels” tab and replot.
The number of data points required to provide a reliable estimate of ammonia losses varies from system to system and can also vary throughout the year. There are times, for example during the fall season as system loads lessen, when the HPR may show an apparent accumulation of refrigerant inventory. Conversely, other times of year may show a much steeper downward trend as loads become more active.
Additional data logged into the tool will help smooth out the various factors that may confound or mask refrigerant losses that are actually occurring. This dynamic inventory calculator is not intended to be the decisive measure of refrigerant losses. It is best used as a guide to accompany other activities meant to reduce refrigerant losses and alert refrigeration personnel to investigate potential refrigerant losses more closely if the downward trend in refrigerant accelerates over time.
It’s important to be cognizant as to how modifications will impact refrigerant inventory in a system as equipment is added or removed. When these changes occur, they not only alter the distribution of refrigerant within the system, but they also alter the trendline of uncontrolled level vessel charge as well. When making system modifications, it is recommended that the plant create a new, separate dataset, and restart the trending process.
Systems that experience significant seasonal or other operational variations may have other options to track refrigerant inventory over time. For a system that is routinely shut down, vessel levels could be taken during shut-down times, thereby eliminating fluctuations from loads.
Conclusion
Fugitive emissions of ammonia to air from industrial refrigeration do occur, but they do not rise to the level of being principally responsible for the refrigerant losses these systems experience over time. Accidental releases and venting of refrigerant during maintenance activities are the two categories more likely responsible for nearly all refrigerant loss during a system’s operating lifetime. Reducing the frequency and severity of accidental releases can be accomplished by developing and implementing sound mechanical integrity programs that regularly inspect and test components. When accidental releases do occur, plants must develop estimates of the quantity of ammonia released during the event and then maintain a running total of the release quantity for reconciling with future system top-offs. Determining the quantity of refrigerant accidentally released can be challenging, but Reindl and Jekel (2016) provide guidance for preparing estimates of refrigerant release quantity associated with incidents and accidents.
Process owners can also take steps to reduce refrigerant losses associated with maintenance activities by recovering and reusing ammonia rather than simply venting the refrigerant to atmosphere or absorbing the ammonia in a water tote for later treatment or disposal. Some plants are equipped with specialized “pumpout systems” where the refrigerant can easily be evacuated from a portion of the system in preparation for maintenance. Most plants do not have dedicated pumpout systems, but those facilities should be capable of making temporary connections to transfer refrigerant from a portion of the system planned for service. This avoids discharging larger quantities of ammonia from the system. The method of dynamic charge calculation introduced in this paper provides a means for plants to identify and estimate a system’s refrigerant loss rate to trigger active leak identification and repair.
As a target, we propose an annual refrigerant loss rate of the lesser of 5%/yr or 2,000 lbm/yr as a threshold for unaccounted refrigerant losses that would prompt an investigation to find and repair a leak. The 5%/yr loss rate threshold is both attainable and reasonable for small-to-moderate size industrial refrigeration systems. For large systems, a fixed loss percentage can translate to significant quantities of ammonia that should not escape the attention of a plant. In this case, the 2,000 lbm/ yr benchmark would be applied as a threshold to trigger an investigation for leaks and initiation of repair as needed.
References
Commission for Instruments and Methods of Observation. CIMO Expert Team on Standardization, Pressure Reduction Formula. Geneva, Switzerland: World Meteorological Organization, November (2012).
EPA, “Risk Management Plan Program,” data derived from RMP submissions analyzed in April (2020).
EPA, Office of Air Quality Planning and Standards, “Protocol for Equipment Leak Emission Estimates,” Research Triangle Park, NC, U.S. Environmental Protection Agency, November (1995).
EPA, Air Emission Measurement Center (EMC), “Method 21 Determination of Volatile Organic Compound Leaks,” https://www.epa.gov/emc/method-21-volatile-organiccompound-leaks, August 3 (2017).
IIAR 6, “Inspecting, Testing, and Maintenance of Safe Closed-Circuit Ammonia Refrigeration Systems,” International Institute of Ammonia Refrigeration, Alexandria, VA (2019).
IIAR ARTG-GDL1, “Ammonia Refrigeration Training Guideline,” International Institute of Ammonia Refrigeration, Alexandria, VA (2007).
IIAR 7, “Standard for Developing Operating Procedures for Closed-Circuit Ammonia Refrigeration Systems,” International Institute of Ammonia Refrigeration, Alexandria, VA (2019).
IRC, “Dynamic Charge Calculation Tool,” Industrial Refrigeration Consortium at the University of Wisconsin-Madison, Madison, WI, https://irc.wisc.edu/file. php?ID=508, (2020a).
IRC, “Guidance Document – Best Practices for Calculating Refrigerant Inventory and Identifying and Reducing Fugitive Emissions,” Industrial Refrigeration Consortium at the University of Wisconsin-Madison, Madison, WI, https://irc.wisc.edu/file.php?ID=510, (2020b).
Reindl DT, Denkmann JL. “Automatic Purgers in Refrigeration Systems,” ASHRAE Journal, Vol. 43, No. 8, pp. 30-36, August (2001).
Reindl DT, Jekel TB. “Revisiting Refrigerant Release Estimates,” IIAR Conference Proceedings, Orlando, FL, March (2016).
Reindl DT. Principles and Practices of Mechanical Integrity Guidebook for Industrial Refrigeration Systems, University of Wisconsin-Madison, Industrial Refrigeration Consortium, ISBN: ISBN: 978-0-0074258-0-2, (2016).
Reindl D, Claas M, Davis J, Grayless J. “Reduction of Fugitive Emissions from Industrial Ammonia Refrigeration Systems” Final Report. EPA Grant Number: 00E02366, (2020a).
Section 608, Clean Air Act and EPA regulations for protection of stratospheric ozone 40 CFR Part 82, Subpart F) prohibit venting of ozone depleting refrigerants (Class I and Class II).
Acknowledgements
This project was funded by U.S. EPA Region 5 as part of the Pollution Prevention (P2) program under Grant Number 00E02366. The investigators would like to thank Christine L. Anderson, Region 5 Pollution Prevention Coordinator and Antoinette Hall, Region 5 Project Officer for their project oversight and support.
The investigators would also like to thank the five facilities willing to host this fugitive emissions investigation, providing numerous insights and ample assistance.